![]()
![]()
![]()

Self-hosted single-binary (<20 MB RSS) that detects I/O anti-patterns (N+1, redundant calls, slow SQL/HTTP, fanout) in your services' OpenTelemetry traces and turns that exact I/O into an energy and carbon estimate. Run it as a CI quality gate on captured traces (or for local exploration and post-mortems), or as a long-running OTLP daemon (live dashboard, Prometheus metrics, query API).
Read this first
- Prerequisite: your services must emit OpenTelemetry traces (SQL + HTTP spans), and those spans must carry the query text (
db.statement/db.query.text) and the target URL (http.url/url.full). Language-specific setup (Java / C# / Rust / Go / Node.js / Python): docs/INSTRUMENTATION.md.- Audit your own tracing first: spans that lack those attributes are dropped silently, with no warning, so a thin or empty report can mean no problems found or no usable instrumentation.
perf-sentinel inspectshows what was actually extracted from your traces, an empty span tree means the carrying attributes are missing upstream. For what instrumentation quality caps: Instrumentation quality bounds findings.- What it is not: a full APM, a continuous profiler, or a standalone regulatory carbon accounting platform (yet). See What perf-sentinel is not.
- Maturity: beta, pre-1.0. The CLI surface, config keys and on-disk formats may still change between releases before 1.0, with breaking changes called out in the release notes. The JSON output enums are the one part under an explicit stability contract (see Input and output formats).
HTML dashboard (single offline file):
perf-sentinel report --input traces.json --output report.html
...or, if you prefer your terminal, an interactive TUI to drill down through Analyze, Inspect and Explain in a single session:
perf-sentinel analyze --tui --input traces.json
Prefer frozen frames you can zoom into panel by panel? Jump to Still frames. The per-command animated demos are collapsed just below.
More demos (analyze, explain, inspect, monitor, pg-stat, calibrate, disclose)
Terminal report (perf-sentinel analyze):

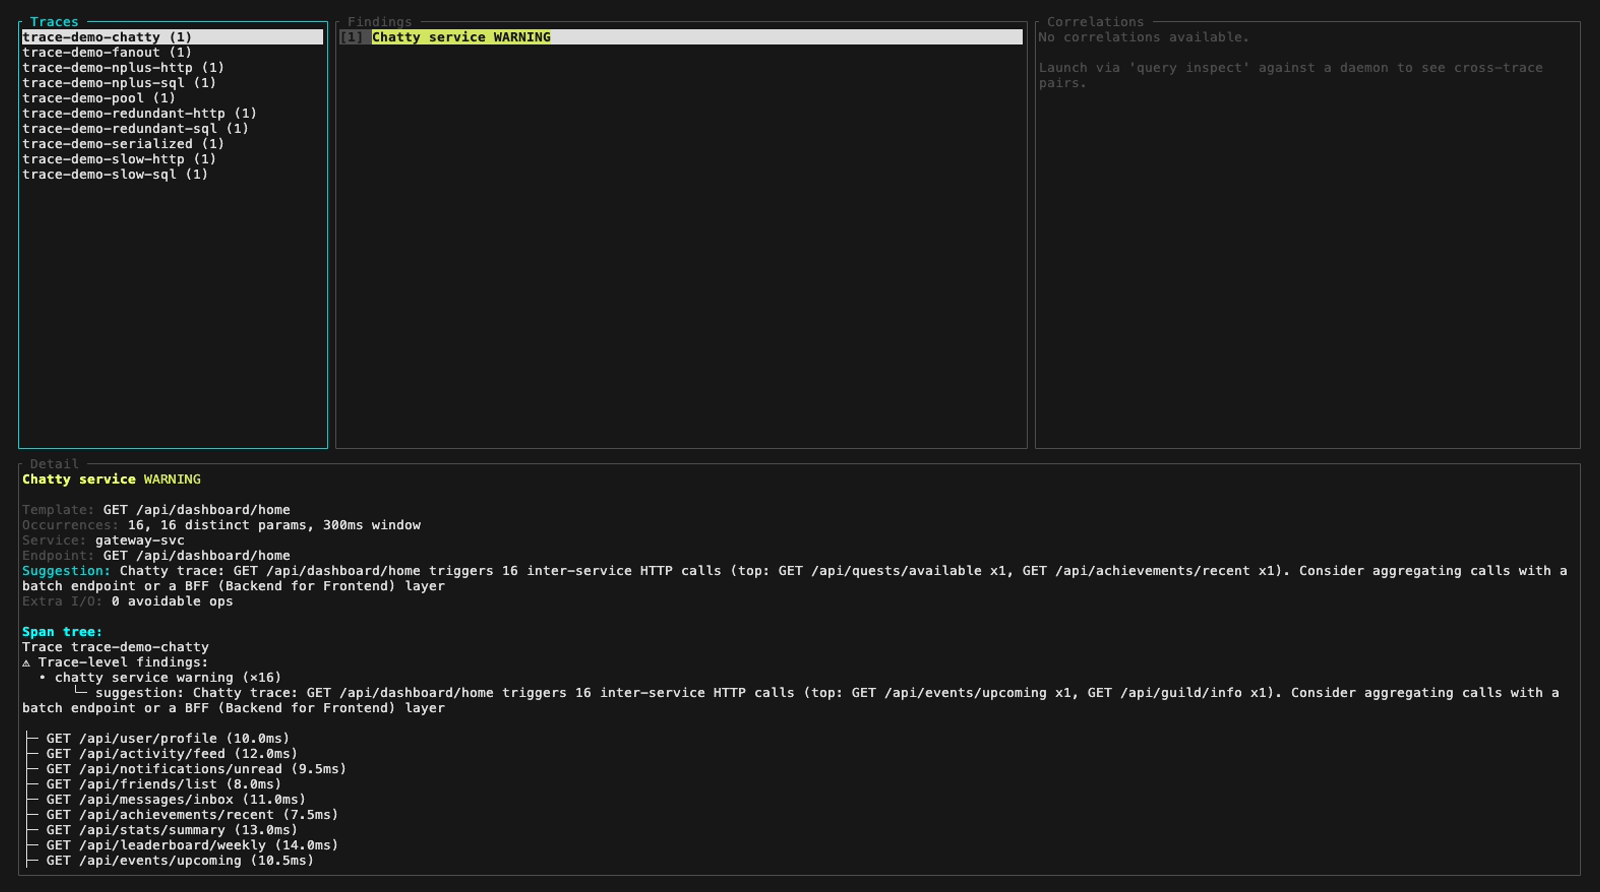
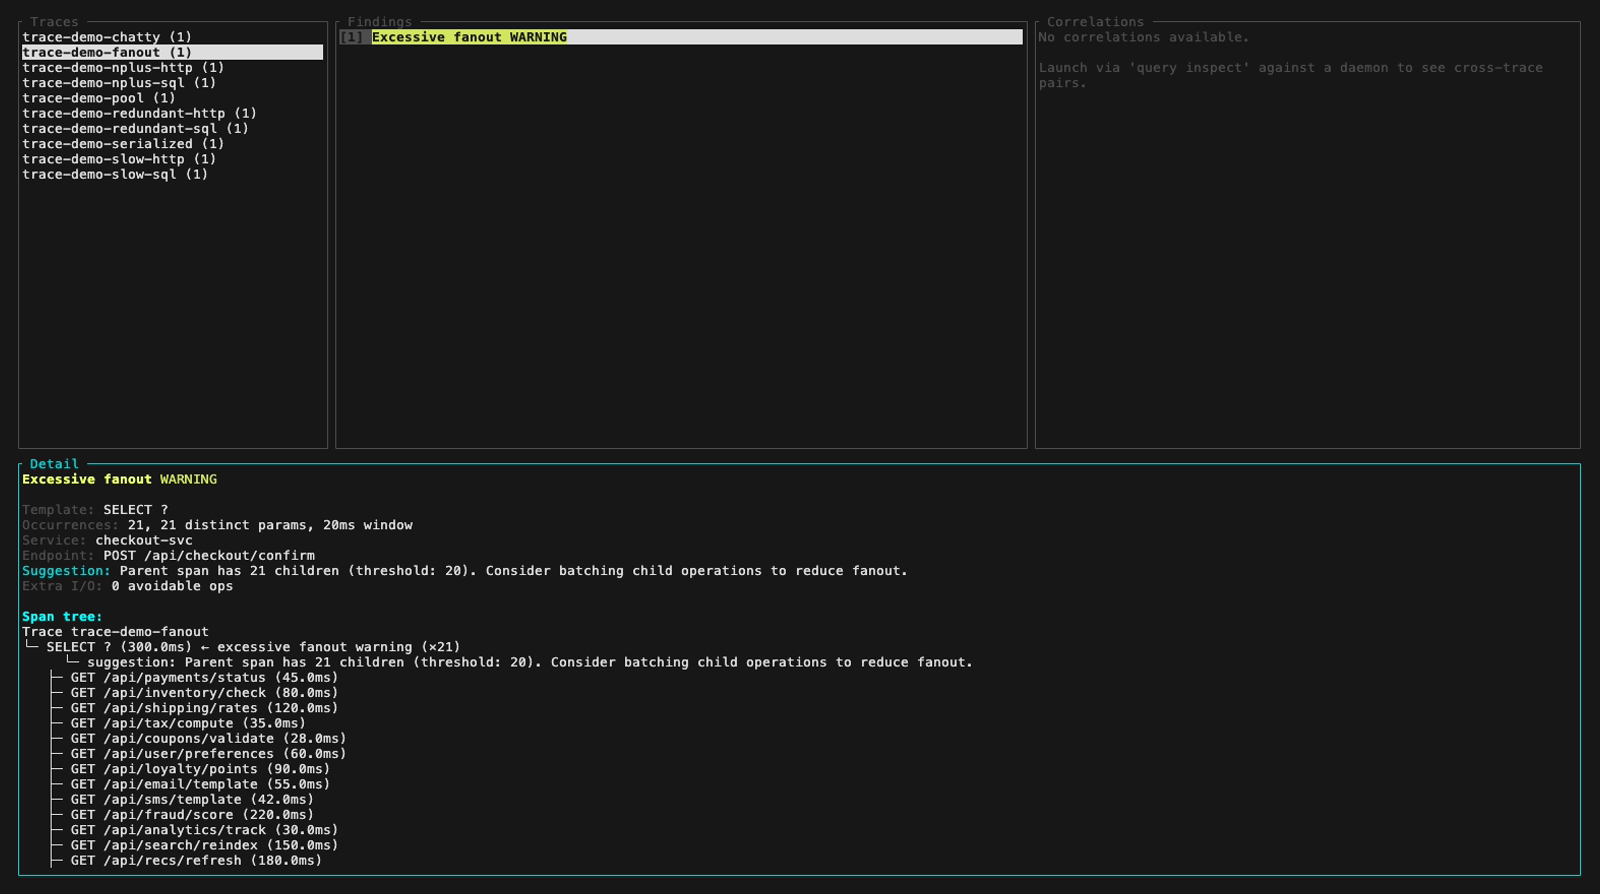
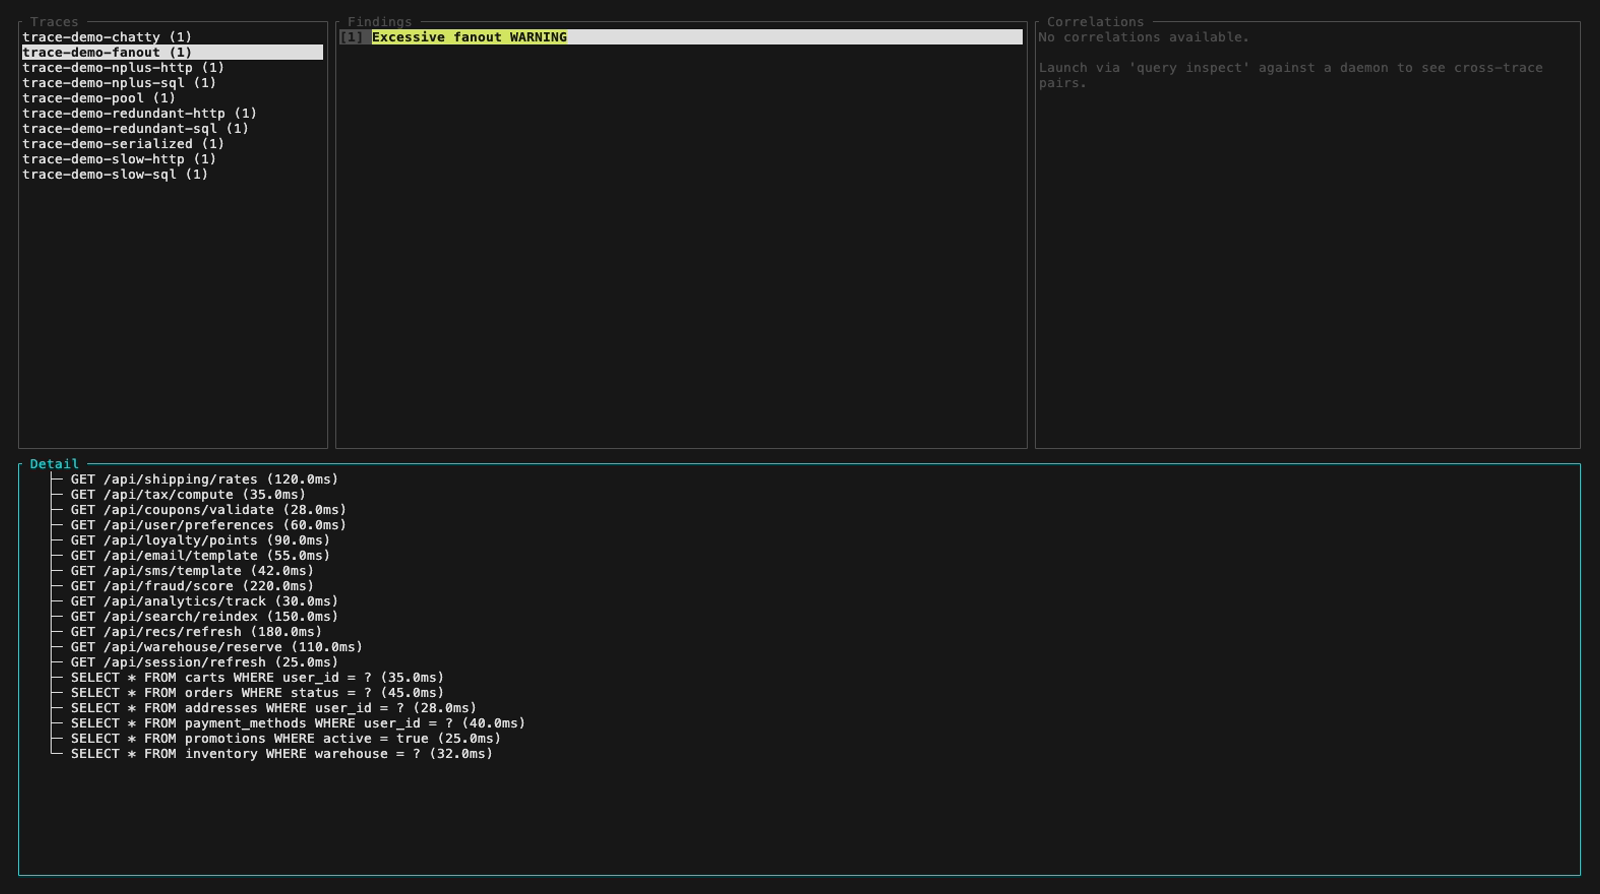
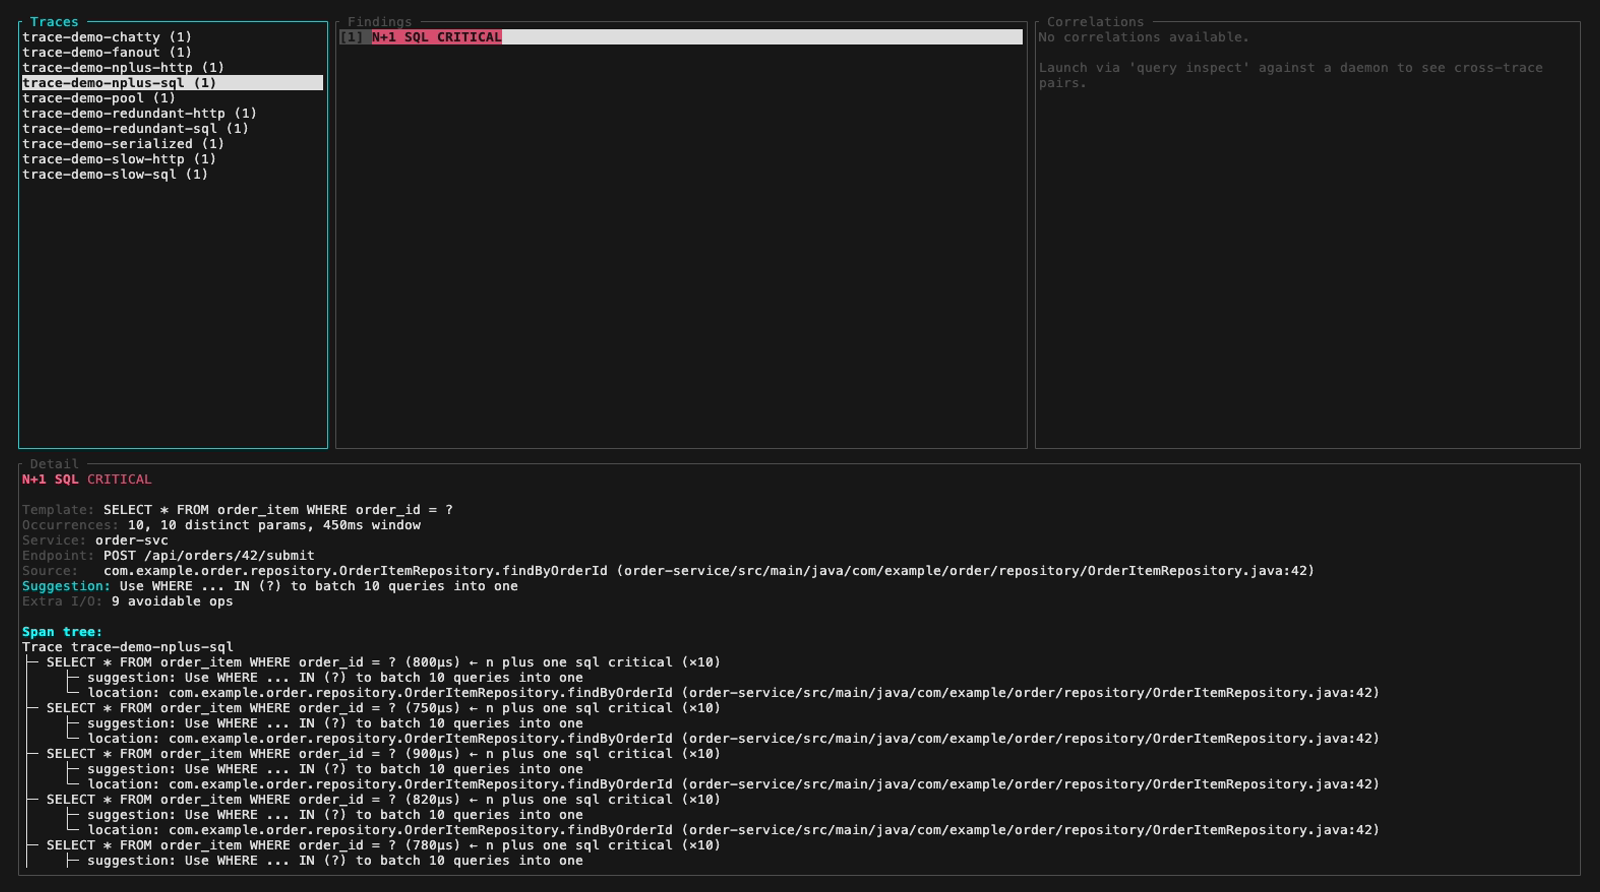
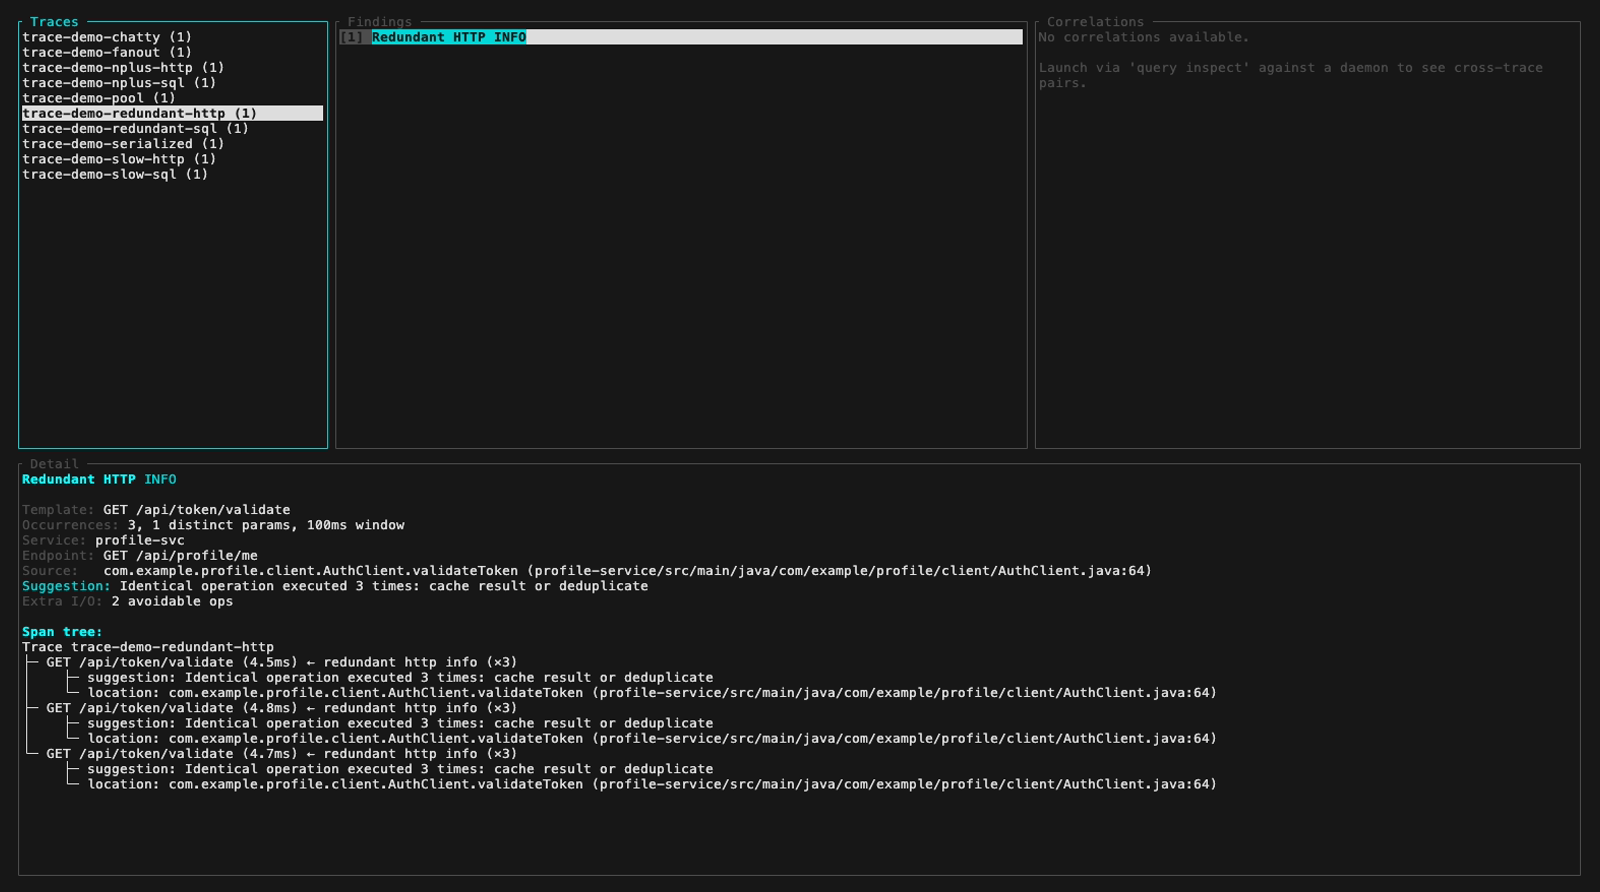
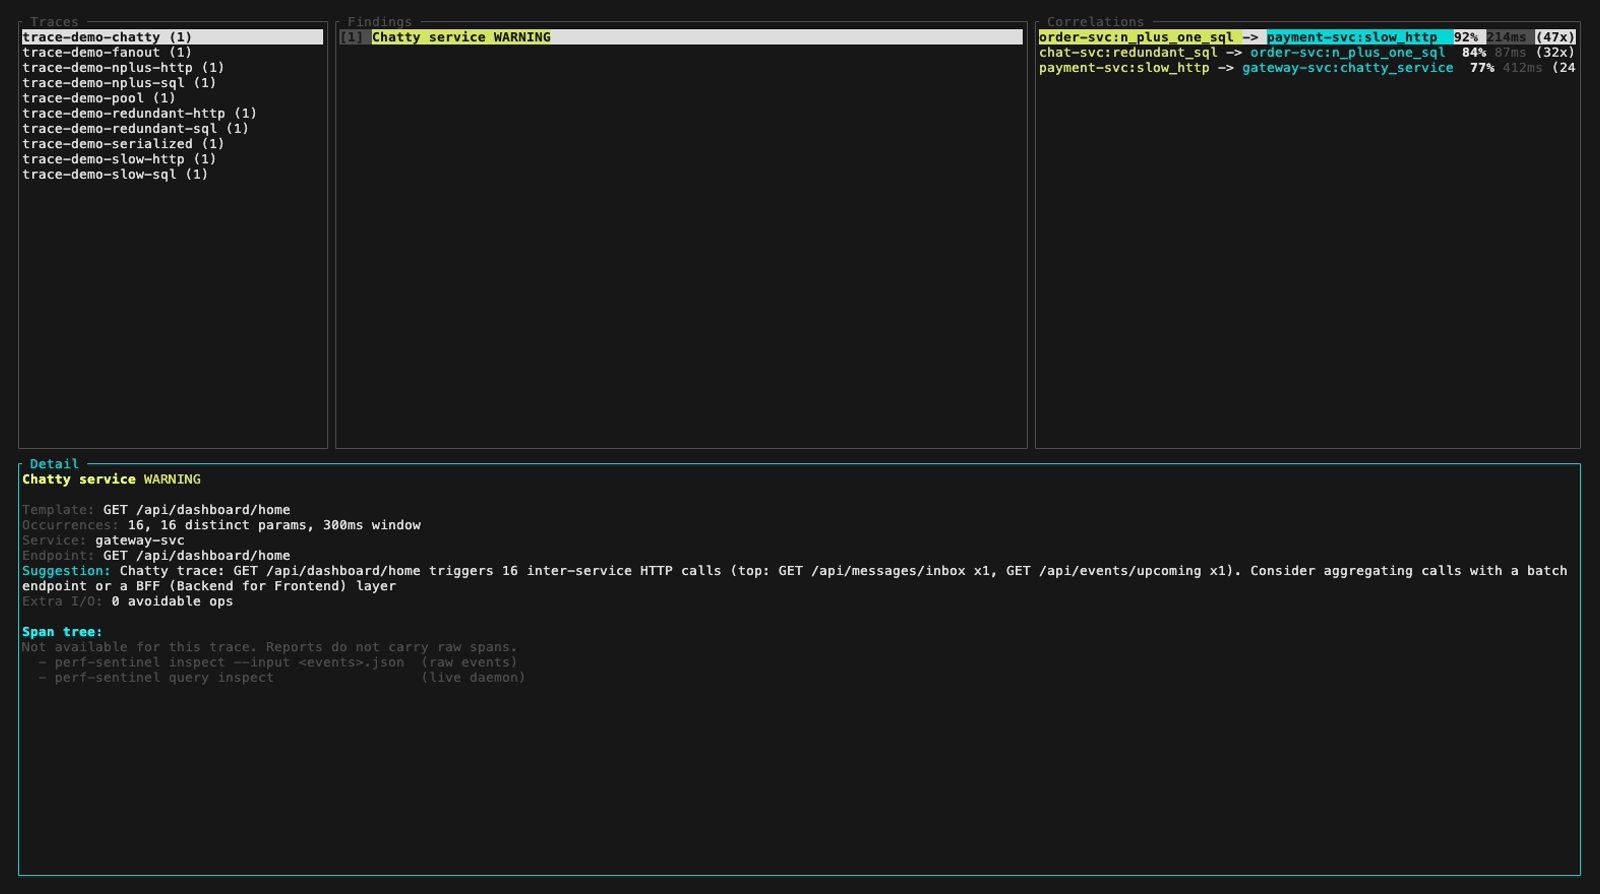
Inspect, the standalone four-panel TUI (perf-sentinel inspect):

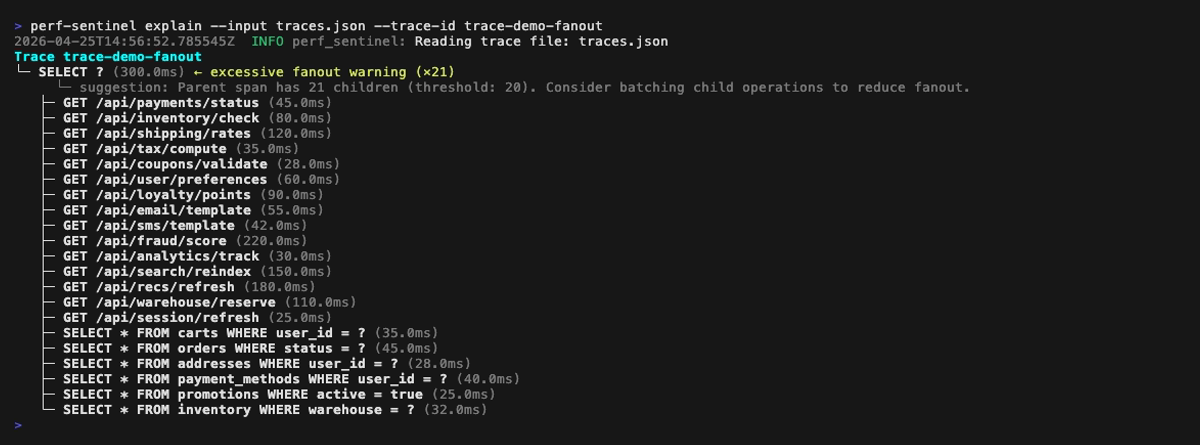
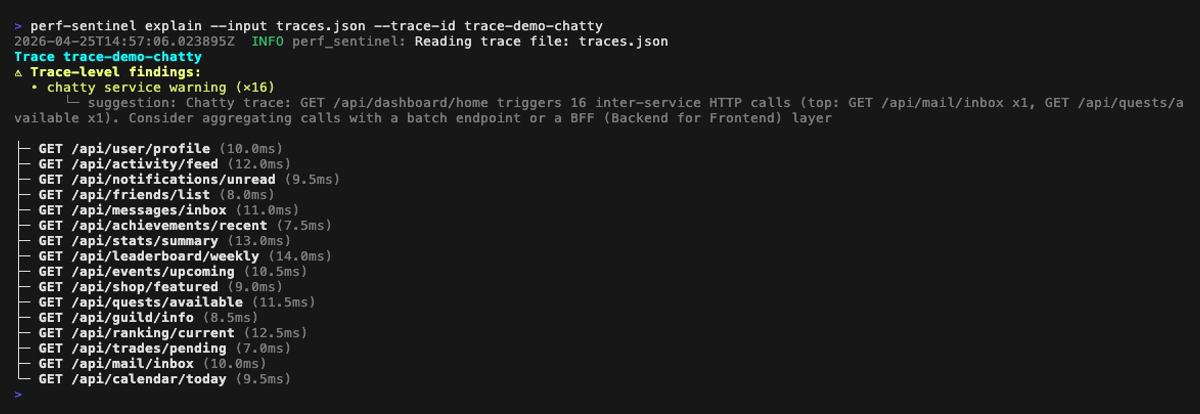
Explain a single trace (perf-sentinel explain --trace-id <id>):

pg_stat_statements hotspots (perf-sentinel pg-stat):

Calibrate energy factors (perf-sentinel calibrate):

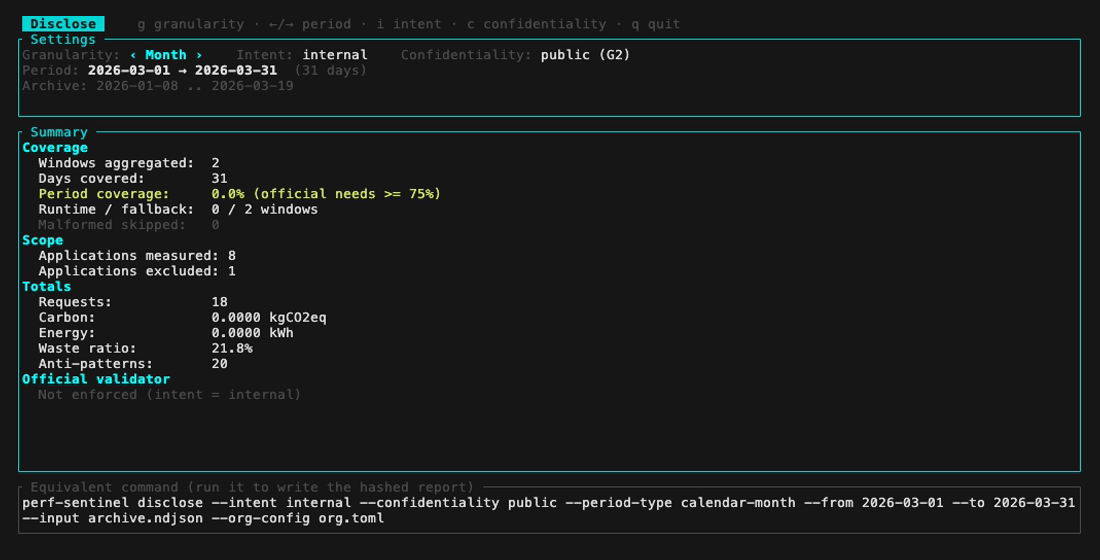
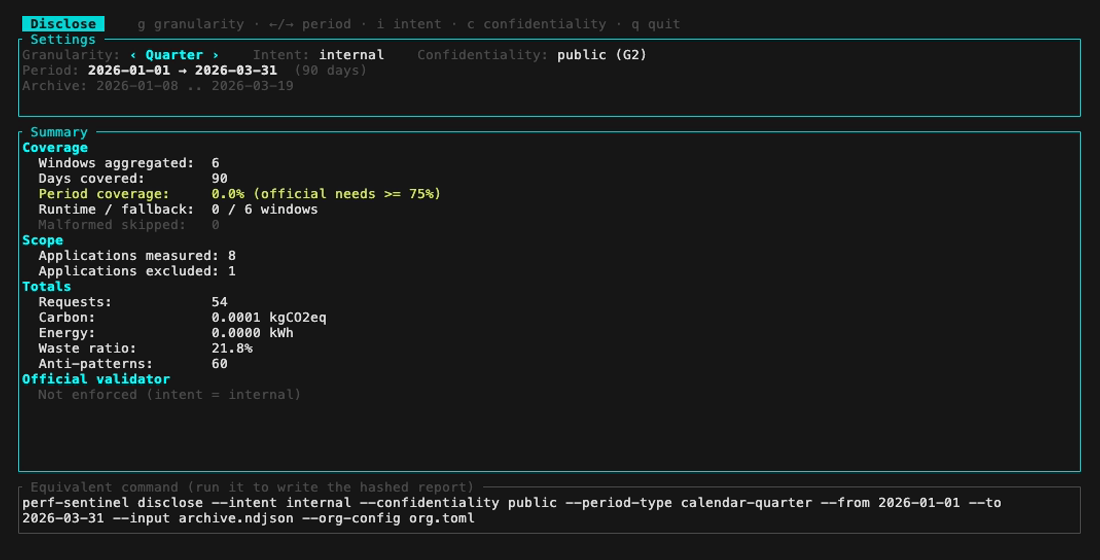
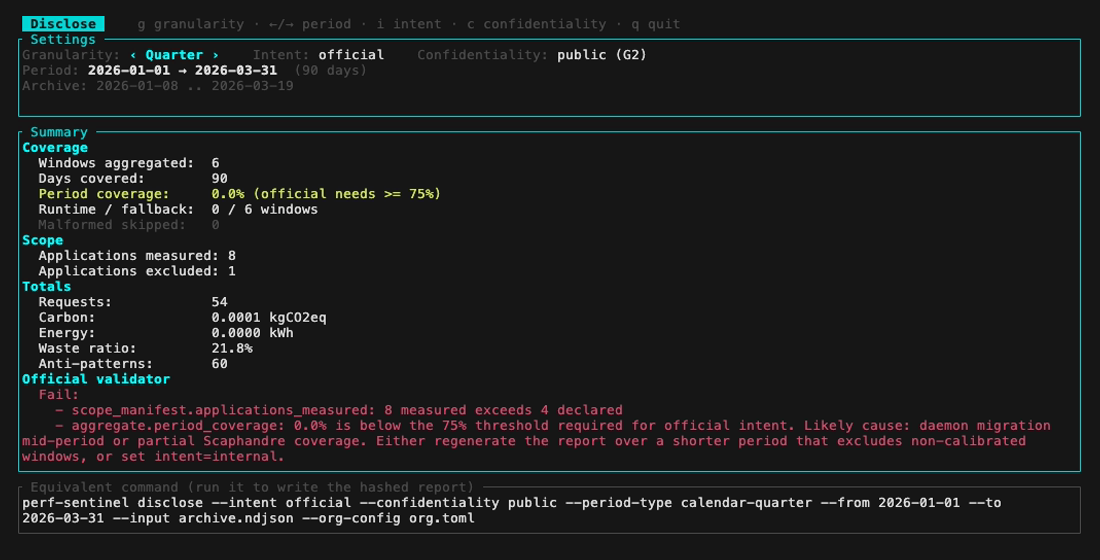
Periodic disclosure preview (perf-sentinel disclose --tui):

Performance anti-patterns like N+1 queries exist in any application that does I/O, monoliths and microservices alike. In distributed architectures, a single user request cascades across multiple services, each with its own I/O, and nobody has visibility on the full path.
Existing tools each solve part of the problem. Hypersistence Utils covers JPA only, Datadog and New Relic are heavy proprietary agents you may not want in every pipeline, Sentry's detectors are solid but tied to its SDK and backend. None of them gives you a protocol-level anti-pattern detector you can self-host, runnable either as a CI quality gate on captured traces (exit 1 on threshold breach, SARIF for code scanning) or as a long-running OTLP daemon (gRPC + HTTP ingestion, Prometheus /metrics, live HTML dashboard, query API, runtime ack workflow) you place alongside or in front of your existing tracing backend.
perf-sentinel observes the traces your application already emits (SQL queries, HTTP calls) regardless of language or ORM. It doesn't need to understand JPA, EF Core or SeaORM, it sees the queries they generate.
Ten finding types, plus cross-trace correlations in daemon mode:
| Pattern | Trigger |
|---|---|
| N+1 SQL | Same query template fired ≥ N times in a single trace |
| N+1 HTTP | Same URL template called ≥ N times in a single trace |
| Redundant SQL | Identical query with identical params, same trace |
| Redundant HTTP | Identical call with identical params, same trace |
| Slow SQL | Query duration above configured threshold |
| Slow HTTP | Request duration above configured threshold |
| Excessive fanout | One span starts ≥ N children in parallel |
| Chatty service | Service A → B repeatedly within one user request |
| Pool saturation | Concurrent in-flight queries exceed configured pool size |
| Serialized calls | Sequential I/O that could be parallelized |
Each finding carries: type, severity, normalized template, occurrences, source endpoint, suggestion, source location (when OTel spans carry code.* attributes), and GreenOps impact (see below). For per-detector severity rules and tunable thresholds, see docs/design/04-DETECTION.md.
# from crates.io
cargo install perf-sentinel --locked

# or download a prebuilt binary (Linux amd64/arm64, macOS arm64, Windows amd64)
curl -LO https://github.com/robintra/perf-sentinel/releases/latest/download/perf-sentinel-linux-amd64
chmod +x perf-sentinel-linux-amd64 && sudo mv perf-sentinel-linux-amd64 /usr/local/bin/perf-sentinel

# or run via Docker
docker run --rm -p 4317:4317 -p 4318:4318 \
  ghcr.io/robintra/perf-sentinel:latest watch --listen-address 0.0.0.0
Linux binaries target musl (fully static, run on any distro and FROM scratch images). A Helm chart is available under charts/perf-sentinel/. See docs/HELM-DEPLOYMENT.md.
# 1. Try the bundled demo (no setup required)
perf-sentinel demo                       # colored terminal report
perf-sentinel demo --tui                 # interactive TUI report
perf-sentinel demo --html demo.html      # HTML dashboard

# 2. Analyze a captured trace file
perf-sentinel analyze --input traces.json

# 3. Use as a CI quality gate (exits 1 on threshold breach)
perf-sentinel analyze --input traces.json --ci --config .perf-sentinel.toml

# 4. Stream traces from your apps (daemon mode)
perf-sentinel watch
demo --html is a full showcase: every dashboard tab is populated (findings, Explain, GreenOps, pg_stat, Diff and synthesized cross-trace correlations). Live ack/revoke is daemon-only, see watch plus query --daemon <URL> monitor.
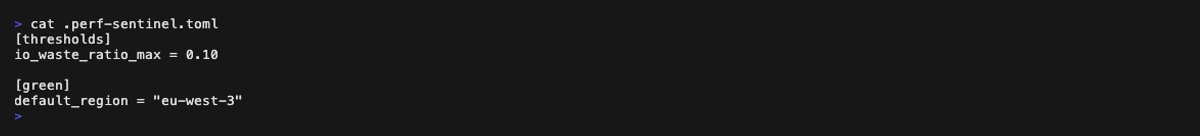
Minimal .perf-sentinel.toml at the repo root:
[thresholds]
n_plus_one_sql_critical_max = 0    # zero tolerance for N+1 SQL
io_waste_ratio_max = 0.30          # max 30% avoidable I/O

[detection]
n_plus_one_min_occurrences = 5
slow_query_threshold_ms = 500
Full subcommand reference: perf-sentinel <cmd> --help, or docs/CLI.md.
Map of the perf-sentinel subcommands and the artifacts they consume or produce

One-liner cheat sheet for the rest of the surface
perf-sentinel explain --input traces.json --trace-id abc123        # tree view of one trace
perf-sentinel inspect --input traces.json                          # interactive TUI
perf-sentinel diff --before base.json --after head.json            # PR regression diff
perf-sentinel pg-stat --input pg_stat.csv --traces traces.json     # PostgreSQL hotspots
perf-sentinel tempo --endpoint http://tempo:3200 --trace-id <id>   # pull from Grafana Tempo
perf-sentinel jaeger-query --endpoint http://jaeger:16686 --service order-svc
perf-sentinel calibrate --traces traces.json --measured-energy rapl.csv
perf-sentinel completions zsh > ~/.zfunc/_perf-sentinel            # shell completions
perf-sentinel man > perf-sentinel.1                                # man page
perf-sentinel query findings --service order-svc                   # talk to a running daemon
Input formats
- Trace files (auto-detected): native perf-sentinel JSON, Jaeger JSON export, Zipkin JSON v2. No
--formatflag needed, the shape is sniffed from the first bytes. Passed via--inputonanalyze,diff,explain,inspect,report,calibrate(or read from stdin byanalyze). See docs/INTEGRATION.md#ingestion-formats. - OTLP live: gRPC on
:4317and HTTP on:4318, ingested by thewatchdaemon from your OTel Collector or SDK. See docs/INTEGRATION.md. - Grafana Tempo: pull traces straight from a Tempo backend with
perf-sentinel tempo. See docs/INTEGRATION.md#tempo-integration. - Jaeger Query API: pull from Jaeger upstream or Victoria Traces with
perf-sentinel jaeger-query. See docs/INTEGRATION.md#jaeger-query-api-integration-jaeger-and-victoria-traces. pg_stat_statements: rank PostgreSQL hotspots from the catalog view withperf-sentinel pg-stat. See docs/INTEGRATION.md.
Output formats
text(default): severity-grouped colored terminal output. Available onanalyze,diff,pg-stat,query,explain,ack.json: structured report. Available onanalyze,diff,pg-stat,query,explain,ack. Full schema in docs/SCHEMA.md, example fixtures in docs/schemas/examples/.sarif(SARIF v2.1.0): GitHub/GitLab code scanning with inline PR annotations viaphysicalLocations. Available onanalyzeanddiff. See docs/SARIF.md.- HTML dashboard: single-file offline report from
perf-sentinel report, click-through trace trees, dark/light theme, CSV export from Findings / pg_stat / Diff / Correlations tabs. See docs/HTML-REPORT.md. - Interactive TUI: three keyboard-driven views in one drill-down (Analyze, Inspect, Explain) from
perf-sentinel analyze --tui,inspect, orexplain --tui(orquery inspectfor live daemon data). See docs/INSPECT.md. - Live daemon: NDJSON findings on stdout, Prometheus
/metricswith Grafana Exemplars,/healthprobe, HTTP query API. See docs/METRICS.md and docs/QUERY-API.md. - Periodic disclosure (optional): hash-verifiable
perf-sentinel-report/v1.0JSON fromperf-sentinel disclose, signable via Sigstore. See docs/REPORTING.md.
The JSON io_intensity_band / io_waste_ratio_band enum values (healthy / moderate / high / critical) are stable across versions, numeric thresholds behind them may evolve. Reference table and rationale in docs/LIMITATIONS.md#score-interpretation.
Output is deterministic: the same input yields byte-identical JSON and SARIF (findings are sorted on a stable key, not HashMap iteration order), so a CI quality gate never flickers and two identical runs produce no spurious PR diff.
Four environments, three deployment models. Full setup in docs/INTEGRATION.md, CI recipes in docs/CI.md, Prometheus metrics in docs/METRICS.md, sidecar example in examples/docker-compose-sidecar.yml.
Models: CI batch (analyze --ci on captured traces, exits 1 on threshold breach), central collector (OTel Collector forwards to watch daemon, Prometheus metrics and query API), sidecar (one daemon per service for isolated debugging). The central collector is a single stateful daemon: horizontal replicas need trace-id-aware load balancing and do not share correlation state, see Daemon state model.
Two behaviours to know before sizing: upstream trace sampling (head-based vs tail-based) and the daemon's own [daemon] sampling_rate both undercount the repetition-based detectors, and under sustained overload the daemon sheds whole analysis batches rather than blocking ingestion, every shed counted in the metrics, never a silent drop. Details and bounded-queue sizing: Upstream sampling and detection accuracy, Sampling in daemon mode and Analysis backpressure and load shedding.
Local dev

CI/CD

Staging

Production

GreenOps (cross-cutting)

End-to-end view: how the four environments fit together

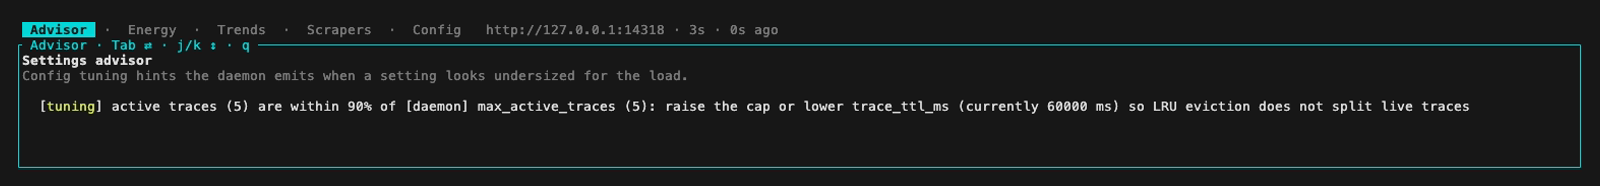
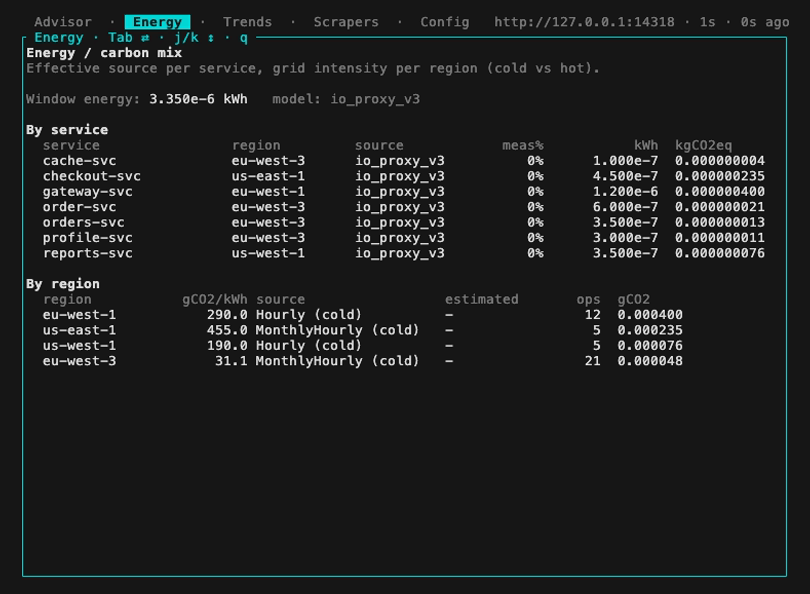
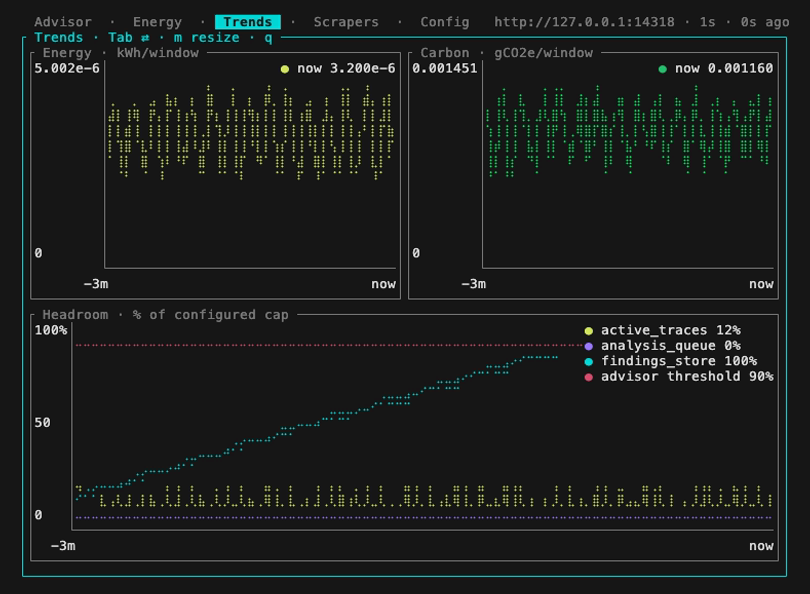
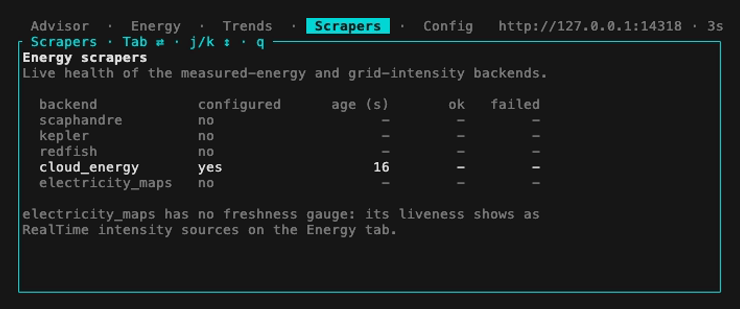
Live operator monitor over a running daemon, for DevOps / SRE, four Tab-cycled tabs (Advisor hints, Energy/carbon mix, Trends charts, Scrapers health) via perf-sentinel query --daemon <URL> monitor:

perf-sentinel processes traces in place. It makes no silent outbound calls and ships no usage telemetry. Raw span content (literal SQL values, full URLs) lives in memory only, inside the streaming window: a 30 s TTL with a 10,000 active-trace LRU cap by default, both tunable under [daemon]. The daemon never writes raw spans to disk. Everything it emits (JSON / SARIF / HTML reports, the query API including /api/explain, Prometheus metrics, the opt-in per-window NDJSON archive) carries the normalized template only: SQL literals and URL path/query values are replaced with ? placeholders and reduced to a distinct-params count, never the values themselves.
The daemon binds to 127.0.0.1 by default. TLS, CORS and the ack API key are all opt-in. The read-only GET endpoints and the OTLP ingestion listeners (gRPC :4317, HTTP :4318) are unauthenticated and trust their senders, so keep ingestion on a trusted network and put a reverse proxy or network policy in front before exposing anything beyond localhost. Retention and listener knobs in docs/CONFIGURATION.md, API surface in docs/QUERY-API.md.
perf-sentinel bench times the analysis pipeline only (normalize -> correlate -> detect -> score), single-threaded, on synthetic datasets: these figures are the pure pipeline cost, not an end-to-end or daemon-under-load benchmark. The exact clock scope and dataset construction are folded below the table.
| Dataset (44,043 synthetic events) | Platform | Pipeline throughput | p50 / p99 per event |
|---|---|---|---|
| Repeated pattern | x86 Xeon 8481C | ~576 k events / sec | 1.72 / 1.88 µs |
| Repeated pattern | Apple M4 Pro | ~1.23 M events / sec | 0.81 / 0.89 µs |
| Varied SQL | x86 Xeon 8481C | ~640 k events / sec | 1.54 / 1.69 µs |
| Varied SQL | Apple M4 Pro | ~1.33 M events / sec | 0.75 / 0.81 µs |
- x86, measured June 2026: GCP c3-standard-8 (Intel Xeon Platinum 8481C @ 2.70 GHz, 8 vCPU), official release 0.8.5
x86_64-unknown-linux-musl(mimalloc allocator). - M4, measured 2026-06-08: Mac mini M4 Pro (12 cores, 24 GB unified memory, macOS 26.5.1), official release 0.8.5
aarch64-apple-darwin(system allocator), run natively on the host.
With the per-platform native artifacts the M4 Pro sustains about 2.1x the throughput of one 8481C vCPU (2.14x repeated, 2.08x varied). p50 / p99 are per-event latency (one iteration's wall time divided by the event count), over 10 iterations. Reproduce with perf-sentinel bench --help. Rust 2024 edition, rustc 1.96.0 stable.
Bench methodology (clock scope, datasets)
File reads, JSON parsing and ingestion all happen before the clock starts, and the input batches are cloned up front. The pipeline is single-threaded (no rayon), so core count does not change the throughput. Both datasets hold 44,043 synthetic events built by duplicating the demo fixture (crates/sentinel-cli/src/demo_data.json), one repeating the same pattern and one with randomized SQL per statement. That isolates pipeline throughput well but does not reflect real production diversity.
Same-chip allocator breakdown (native macOS vs Docker musl)
The x86 musl artifact links mimalloc while the macOS arm64 artifact uses the system allocator, so the cross-platform binaries differ by allocator as well as by ISA. To isolate that, the musl + mimalloc release (the linux/arm64 artifact) was also benched on the same M4 Pro inside a Docker linux/arm64 container, over the same datasets:
| Build on the same M4 Pro | Repeated pattern | Varied SQL |
|---|---|---|
| Native macOS arm64, system allocator | ~1.23 M events / sec | ~1.33 M events / sec |
| Docker linux/arm64, musl + mimalloc | ~1.39 M events / sec | ~1.51 M events / sec |
Same chip, same datasets: the musl + mimalloc build runs about 13% faster than the native macOS allocator, which confirms the allocator as the main reason the Docker numbers run higher. Compared like for like (both musl + mimalloc), the M4 Pro is then about 2.4x the x86 8481C (2.41x repeated, 2.36x varied).
Memory: bench rss_peak_bytes vs daemon footprint
bench also prints rss_peak_bytes, but that value is dominated by the pre-cloned input batches kept in memory (10 iterations x 44,043 events), so it is not the daemon's memory footprint. It is also not comparable across operating systems: rss_peak_bytes reads the current RSS from /proc on Linux but the peak RSS via getrusage on macOS.
Separately, the long-running daemon's memory was profiled on the same M4 Pro using the musl + mimalloc build inside a Docker Desktop linux/arm64 VM (15.6 GB). It idles at ~17 MB (the <20 MB RSS figure quoted in the TL;DR and the comparison table, apples-to-apples with the idle-agent figures for the other tools). The native build idles at ~10 MB, mimalloc trades a little RSS for allocator speed. Under a sustained ~1.0 M events / sec ingestion load it peaks at ~190 MB (down from 237 MB on 0.6.1, under the 250 MB ceiling).
Every finding carries an I/O intensity score (IIS), total I/O ops for an endpoint divided by invocations, and an I/O waste ratio (avoidable ops / total ops). Reducing N+1 queries and redundant calls improves response times and energy use; these are not competing goals.
co2.total is reported as the Software Carbon Intensity v1.0 / ISO/IEC 21031:2024 numerator (E × I) + M, summed over analyzed traces. Multi-region scoring is automatic when OTel spans carry cloud.region. In daemon mode, energy can be refined via measured sources (Scaphandre RAPL on x86, Kepler eBPF on ARM and x86, Redfish BMC for bare-metal wall-plug power, or cloud-native CPU% + SPECpower), and grid intensity pulled live from Electricity Maps.
The carbon side of perf-sentinel prices the detected I/O with the rigor of a specialized software / compute emissions calculator: activity-based methodology, region-hourly grid intensity (Electricity Maps, ENTSO-E, RTE, National Grid ESO, EIA, ...), bottom-up embodied carbon (Boavizta + HotCarbon 2024) and Sigstore-signed, hash-verifiable disclosures.
It is suitable as a primary data source for a horizontal carbon accounting platform, or as an internal controlling tool for software-emissions KPIs and RGESN conformance.
It is not yet third-party verified for standalone CSRD / GHG Protocol Scope 2/3 inventory reporting, which requires audit by a qualified body and integration with non-IT scopes. CO₂ figures carry a
~2×uncertainty bracket in the default proxy mode (tighter with any measured-energy source: Scaphandre RAPL, Kepler eBPF, Redfish BMC, or cloud SPECpower + calibration). Methodology, sources and bounds: docs/LIMITATIONS.md#carbon-estimates-accuracy and docs/METHODOLOGY.md.
Concrete pairings: pass the I/O counts and per-region energy estimates to Watershed, Sweep, Greenly or Persefoni as activity data; or use perf-sentinel directly to demonstrate RGESN (Référentiel Général d'Écoconception de Services Numériques, ARCEP/Ademe/DINUM 2024) software-optimization conformance, where N+1 detection, redundant calls, caching and fanout reduction map onto the corresponding criteria.
For organisations who still want to publish a non-regulatory periodic efficiency disclosure (quarterly/yearly JSON, optional Sigstore signature), the optional perf-sentinel disclose workflow is documented in docs/REPORTING.md. It is intentionally kept off the main quickstart path.
perf-sentinel's niche is being lightweight, protocol-agnostic, CI/CD-native and carbon-aware, not replacing a full observability suite.
| Capability | Hypersistence Optimizer | Datadog APM + DBM | New Relic APM | Sentry | Digma | Grafana Pyroscope | OTJAE | perf-sentinel |
|---|---|---|---|---|---|---|---|---|
| N+1 SQL detection | JPA only, test-time | Yes, automatic (DBM) | Yes, automatic | Yes, automatic OOTB | Yes, IDE-centric (JVM/.NET) | No (CPU/memory profiler, not a query analyzer) | No | Yes, protocol-level, any OTel runtime |
| N+1 HTTP detection | No | Yes, service maps | Yes, trace correlation | Yes, N+1 API Call detector | Partial | No | No | Yes |
| Polyglot support | Java only | Per-language agents | Per-language agents | Per-SDK, most languages | JVM + .NET (Rider beta) | eBPF host-wide + per-language SDKs | JVM (extension of the OTel Java agent) | Any OTel-instrumented runtime |
| Cross-service correlation | No | Yes | Yes | Yes | Limited (local IDE) | Trace-to-profile via OTel exemplars | In-JVM only, no cross-service attribution documented | Via trace ID |
| Per-span carbon/energy attribution | No | No | No | No | No | No | Yes, per span and per transaction (CCF methodology) | Yes, per span (SCI-aligned, directional) |
| GreenOps scoring (IIS, waste ratio) | No | No | No | No | No | No | No | Built-in (directional) |
| Runtime footprint | Library (no overhead) | Agent (~100-150 MB RSS) | Agent (~100-150 MB RSS) | SDK + backend | Local backend (Docker) | Agent + backend (~50-100 MB RSS depending on language) | JVM agent (overhead not published) | Standalone binary (<20 MB RSS) |
| Native CI/CD quality gate | Manual test assertions | Alerts, no build gate | Alerts, no build gate | Alerts, no build gate | No | No | No | Yes (exit 1 on threshold breach) |
| License | Commercial (Optimizer) | Proprietary SaaS | Proprietary SaaS | FSL (converts to Apache-2 after 2y) | Freemium, proprietary | AGPL-3.0 | Apache-2.0 | AGPL-3.0 |
| Pricing / self-hostable | One-time license fee | Usage-based SaaS (no self-host) | Usage-based SaaS (no self-host) | Free tier + SaaS plans (no self-host) | Freemium SaaS (no self-host) | Free, fully self-hostable | Free, fully self-hostable | Free, fully self-hostable |
Agent footprint figures for commercial APMs are order-of-magnitude estimates from public deployment reports; actual overhead depends on instrumentation scope.
A fair comparison requires naming what perf-sentinel does not do:
- Not a full APM replacement. No dashboards, no alerting UI, no RUM, no log aggregation, no distributed profiling. If you need those, Datadog, New Relic and Sentry remain the right tools.
- Not a continuous profiler. It observes I/O patterns at the protocol level; it does not sample on-CPU time, allocations or stack traces. For flame graphs and language-aware CPU/memory profiling, Grafana Pyroscope is the open-source counterpart and pairs well: pyroscope tells you where compute time goes, perf-sentinel tells you which I/O patterns drive that time.
- Not a real-time monitoring solution. Daemon mode streams findings, but the project's center of gravity is CI quality gates and post-hoc trace analysis, not live prod observability.
- Not a standalone regulatory carbon accounting platform. Standalone CSRD or GHG Protocol Scope 2/3 reporting requires third-party verification and non-IT scopes it does not cover. Exact scope, pairings (Watershed, Sweep, Greenly, Persefoni) and the RGESN case: see GreenOps.
- Not a replacement for measured energy. The I/O-to-energy model is an approximation. For accurate measured power, plug in Scaphandre (x86 RAPL), Kepler (eBPF, ARM-friendly) or Redfish (bare-metal BMC wall-plug), all three supported as inputs, or use cloud provider energy APIs. For what software-only attribution can and cannot cover on a typical server, see docs/LIMITATIONS.md § What software-only attribution covers.
- Not zero-config. Protocol-level detection requires OTel instrumentation in your apps. If your stack does not emit traces, perf-sentinel has nothing to analyze.
- Not an IDE plugin. For in-IDE feedback on JVM/.NET code as you type, Digma offers a well-integrated JetBrains experience.
Drop .perf-sentinel-acknowledgments.toml at your repo root to suppress findings the team has accepted; they are filtered from analyze / report / inspect / diff and do not count toward the quality gate. Runtime acks against a live daemon are exposed via the ack CLI, the live HTML dashboard, and the TUI. Full reference: docs/ACKNOWLEDGMENTS.md and docs/ACK-WORKFLOW.md.
The Quick look section at the top shows live GIFs. The frozen frames below let you zoom in on individual panels for readability.
Still frames (TUI, analyze, explain, inspect, pg-stat, calibrate, disclose, report)
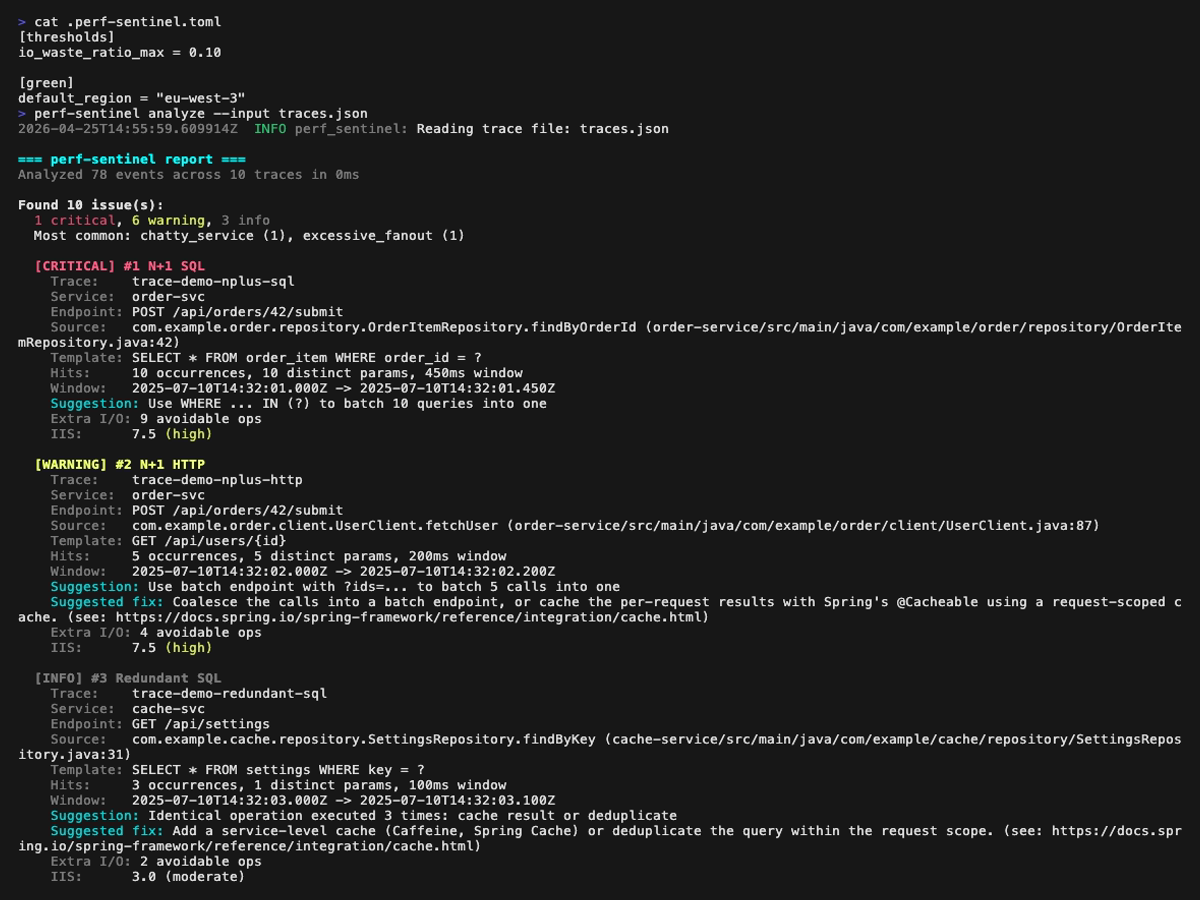
Configuration (.perf-sentinel.toml):
All-in-one TUI (perf-sentinel analyze --tui). One session drills down Analyze, Inspect and Explain via Enter, Esc walks back up, the tab bar tracks the active view:
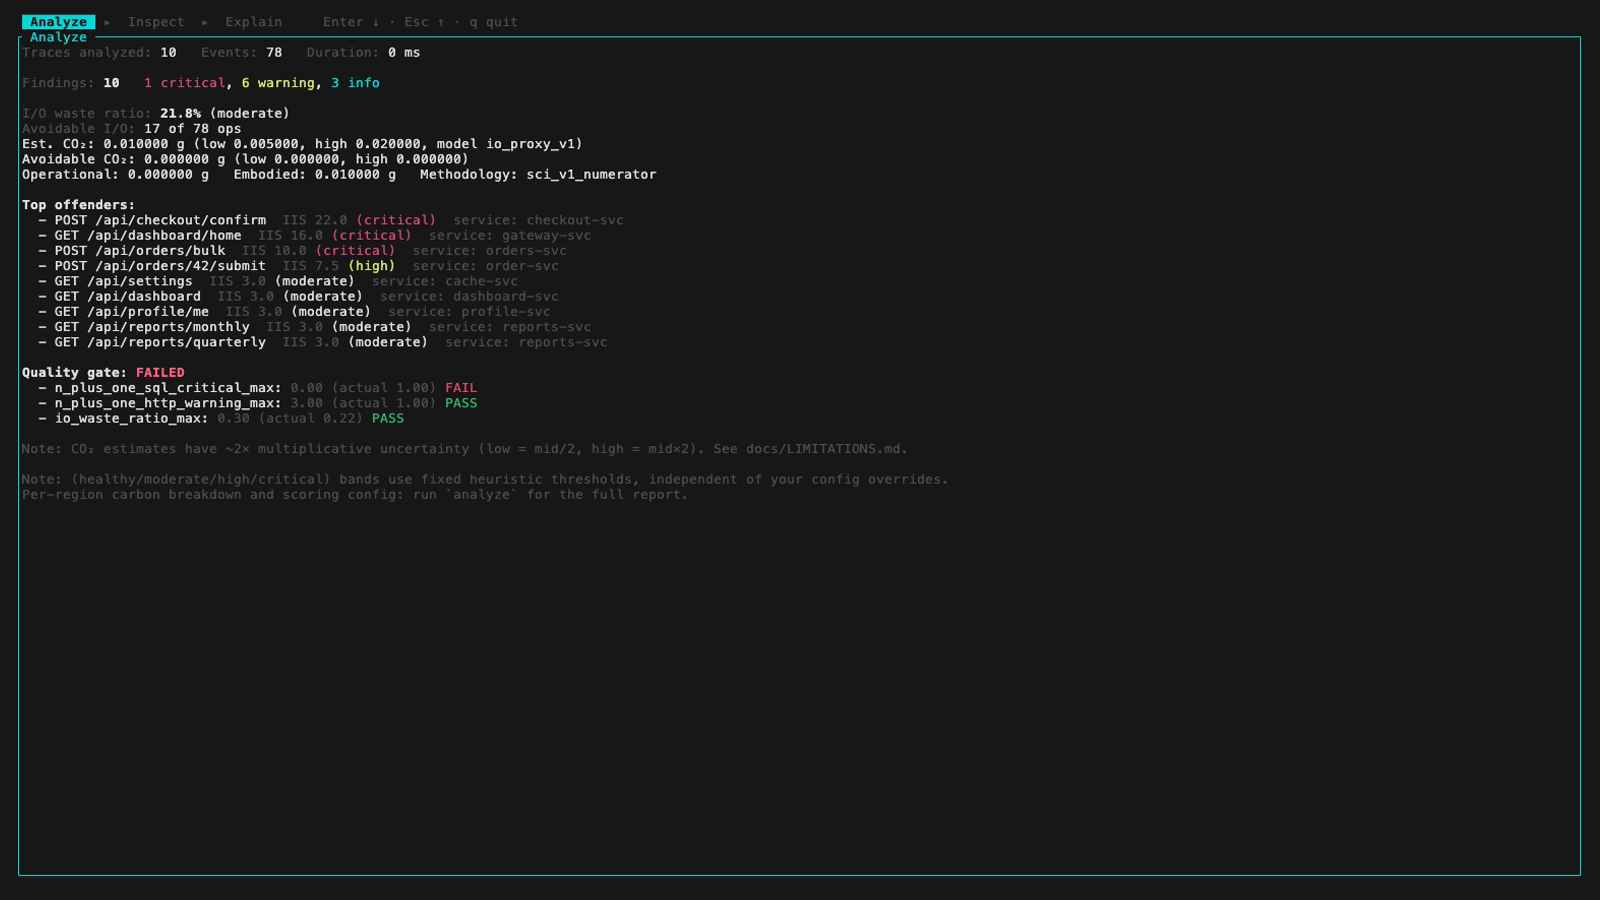
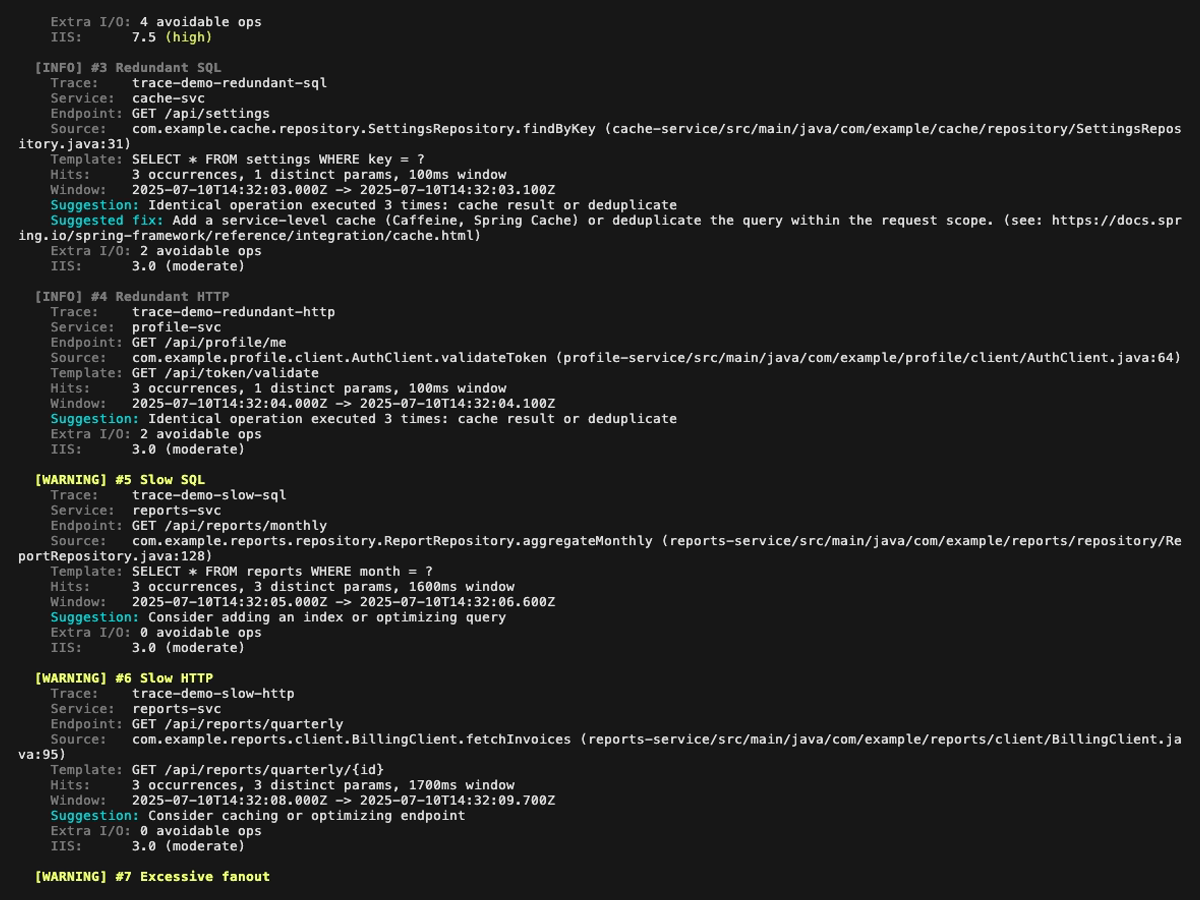
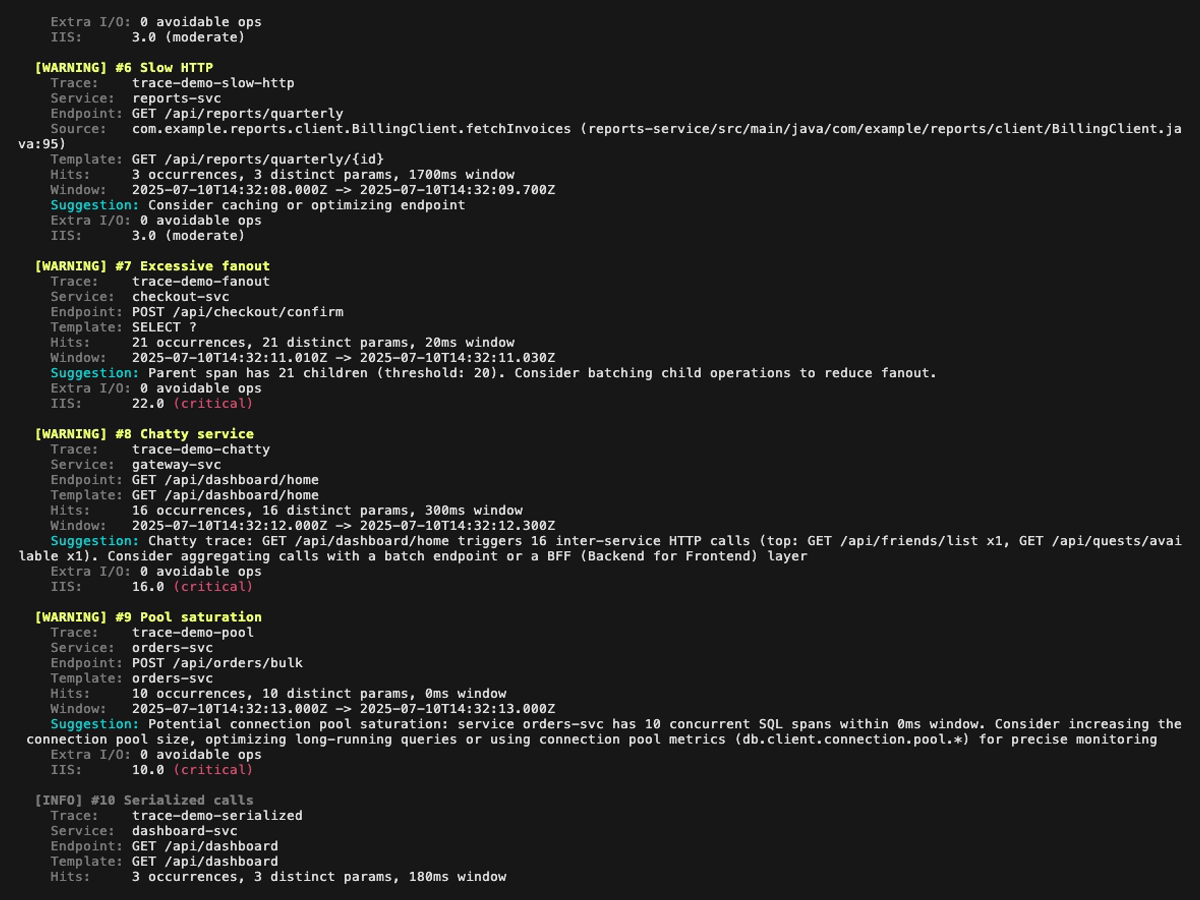
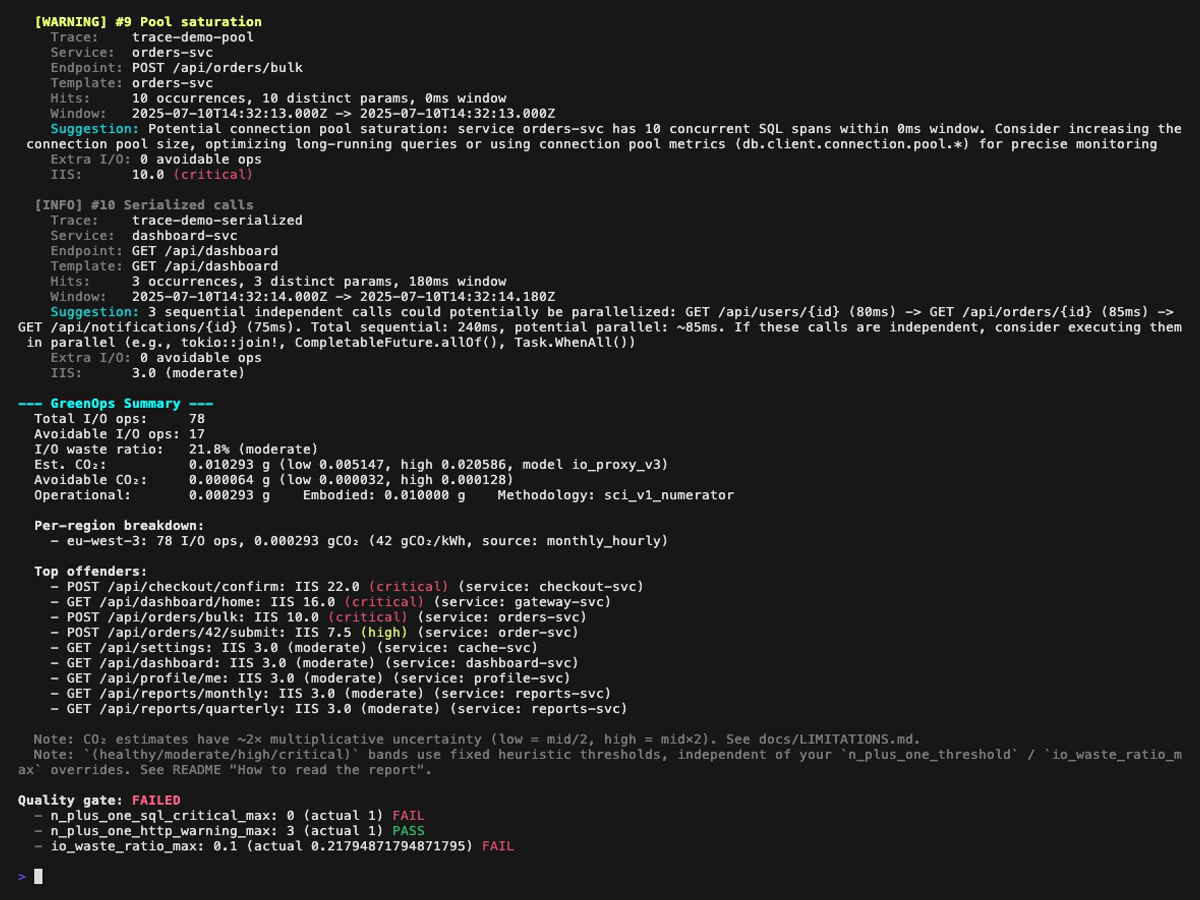
Analysis report (perf-sentinel analyze) page by page, with a small overlap so every finding appears fully on at least one page:
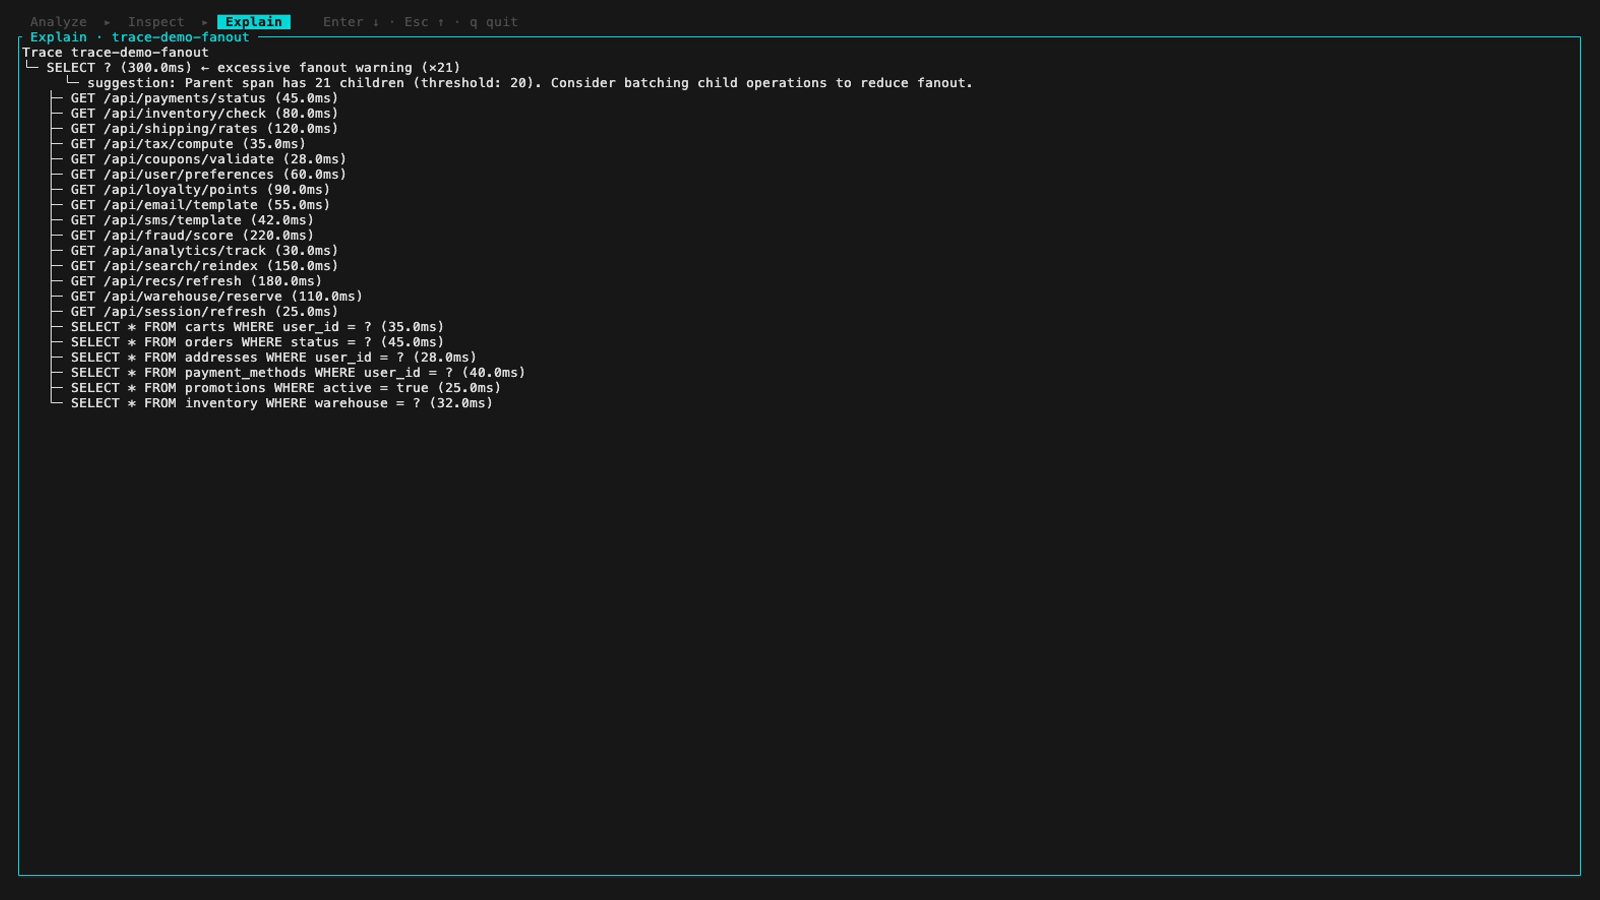
Explain mode (perf-sentinel explain --trace-id <id>). Span-anchored findings (N+1, redundant, slow, fanout) are rendered inline next to the offending spans; trace-level findings (chatty service, pool saturation, serialized calls) are surfaced in a dedicated header above the tree:
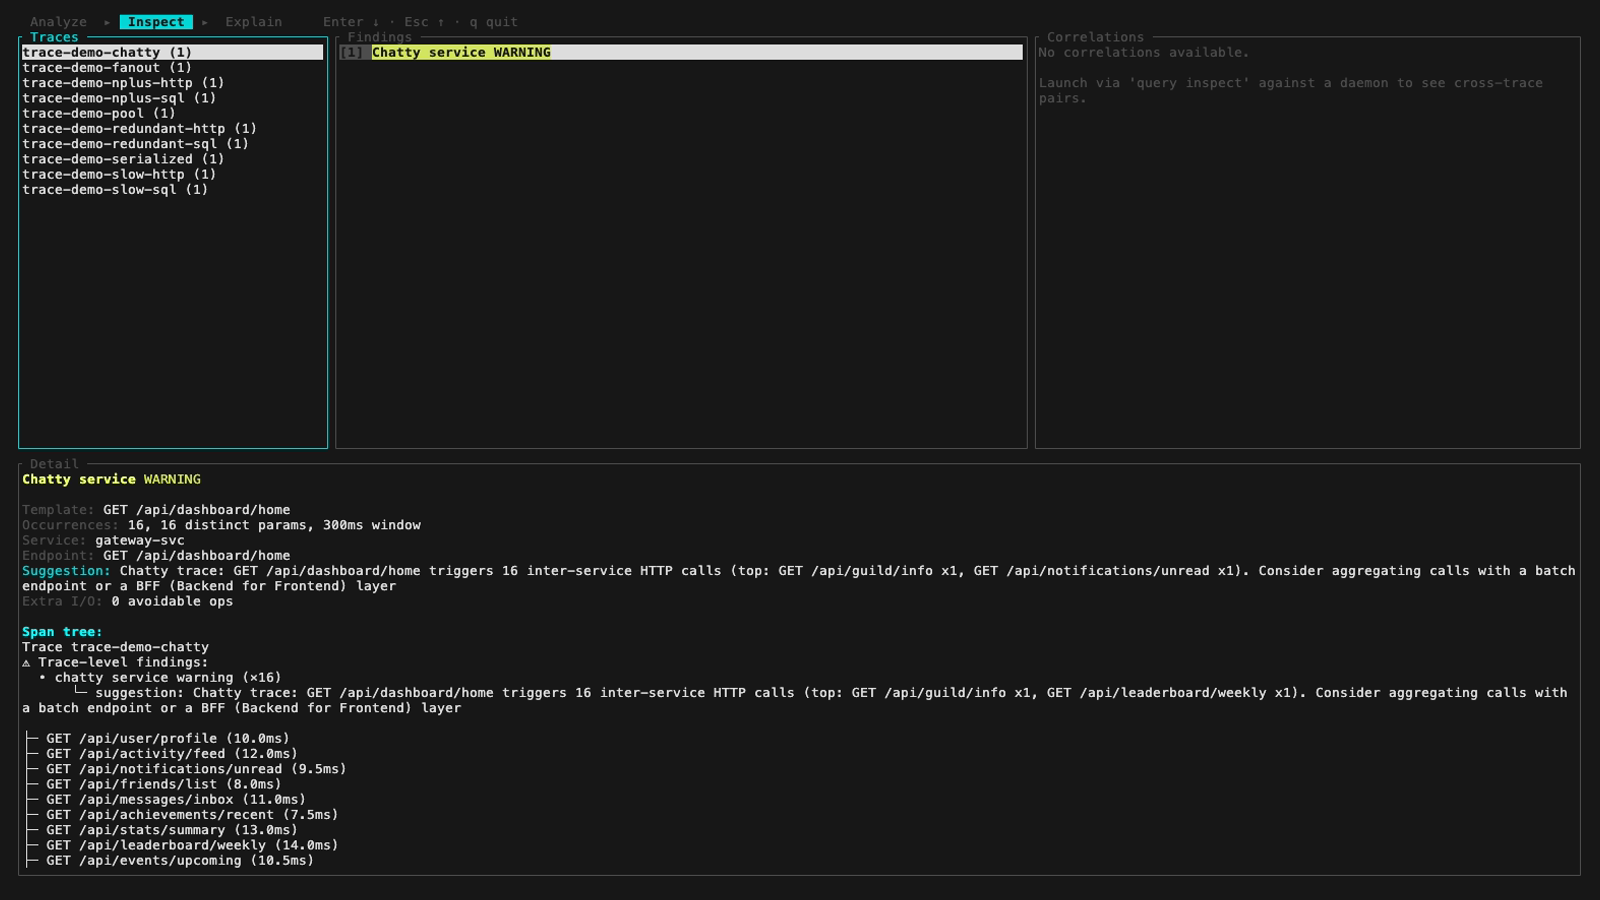
Inspect mode (perf-sentinel inspect). The findings panel header colors findings by severity, below are five frames walking the demo fixture across the three severity levels plus a detail-panel view with its scroll feature:
inspect --input also auto-detects a pre-computed Report JSON (e.g. a daemon snapshot from /api/export/report). Findings and Correlations panels light up fully, the Detail panel surfaces a span-tree-unavailable hint that points at the two paths which do carry raw spans:
Live operator monitor (perf-sentinel query --daemon <URL> monitor). Read-only, daemon-backed, four Tab-cycled tabs. The data it surfaces (config hints, source provenance, per-region intensities) is categorical and high-cardinality, exactly what the bounded-label rule keeps off Prometheus /metrics:
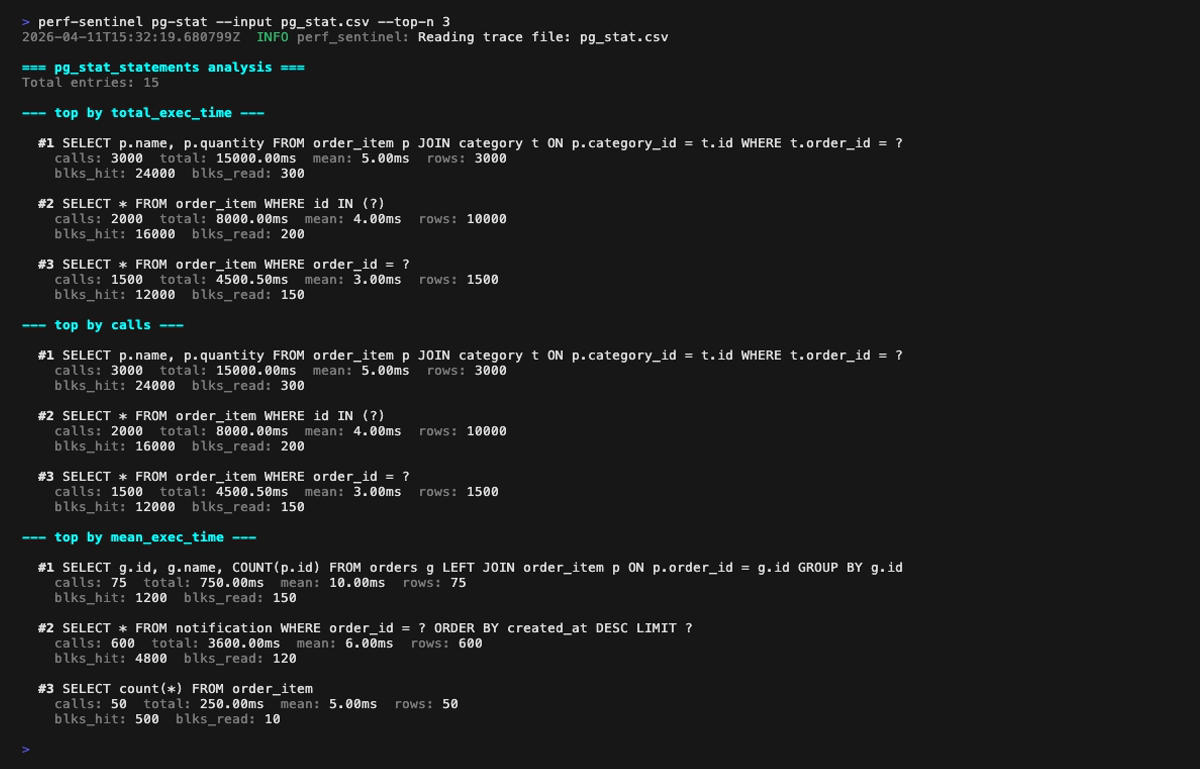
pg-stat mode (perf-sentinel pg-stat --input <pg_stat_statements.csv>): ranks SQL queries by total execution time, by call count, by mean latency. Cross-reference with your traces via --traces to spot queries that dominate the DB without showing up in instrumentation:
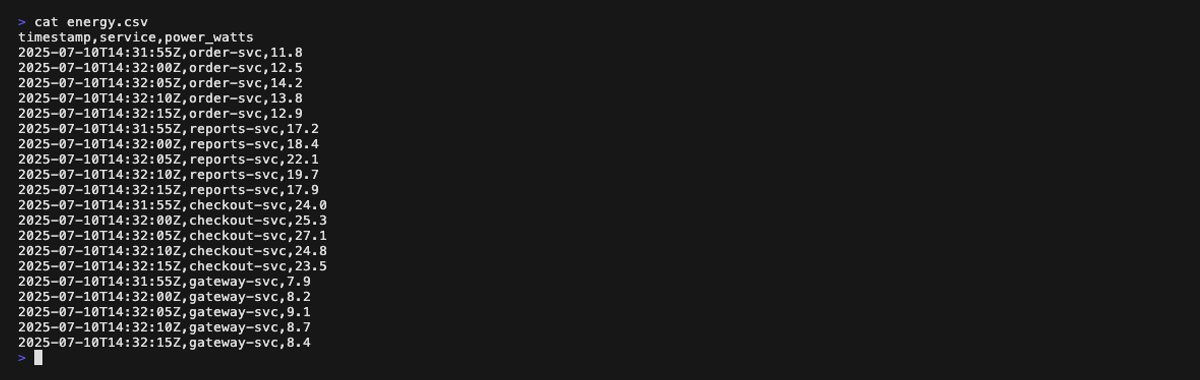
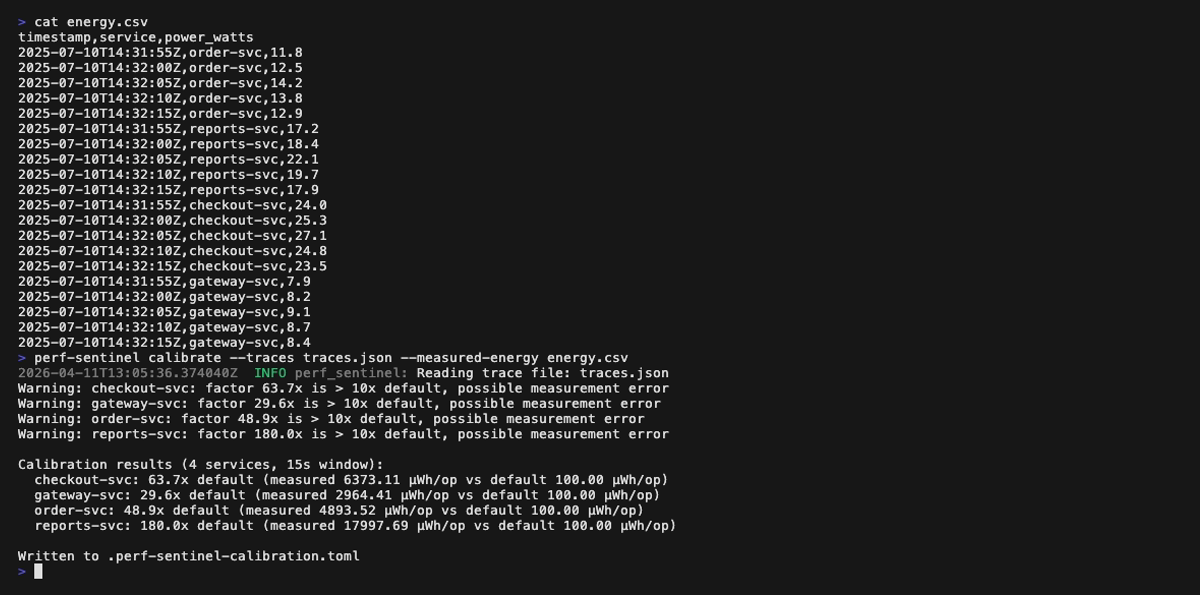
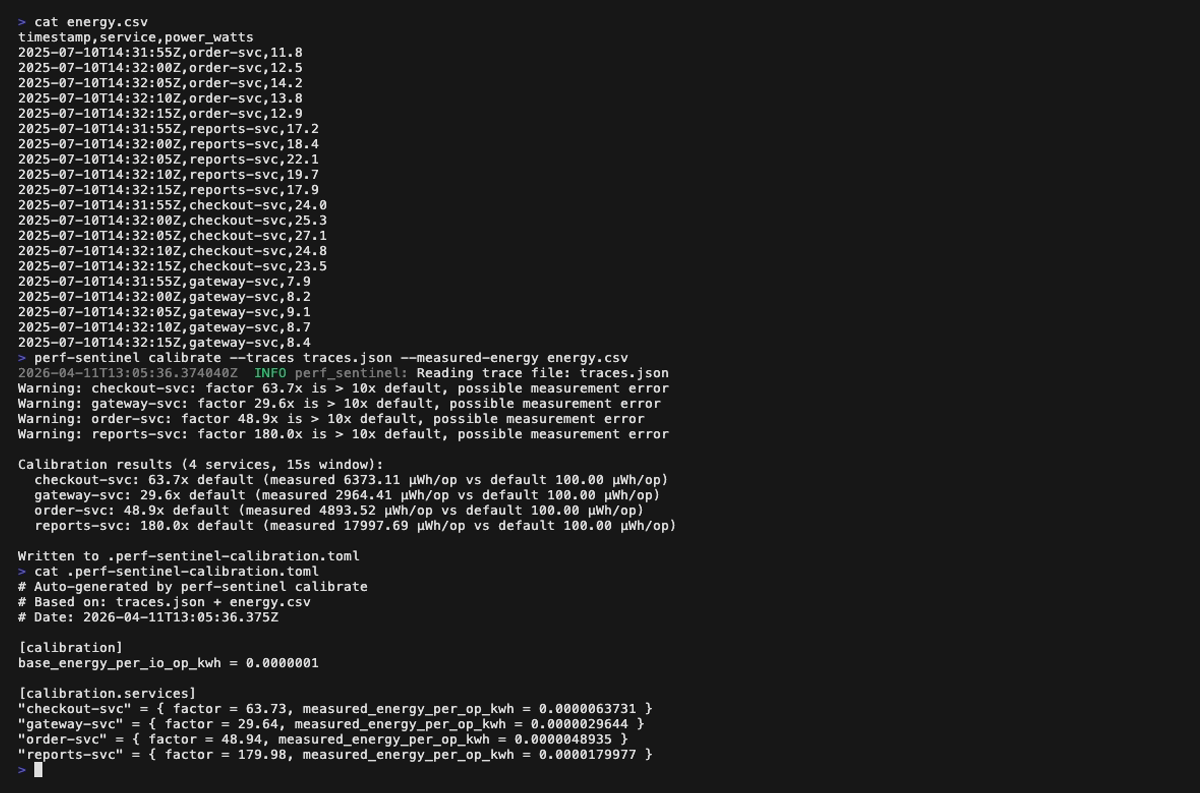
Calibrate mode (perf-sentinel calibrate --traces <traces.json> --measured-energy <energy.csv>):
Disclose preview (perf-sentinel disclose --tui). A read-only preview of the periodic disclosure: a calendar stepper over the period, live intent and confidentiality toggles, and the equivalent command to copy. It never writes or hashes a report:
Report dashboard (perf-sentinel report), one still per tab. Each <picture> serves the dark variant when your browser advertises prefers-color-scheme: dark:


| Topic | Document |
|---|---|
| Table of contents | docs |
| CLI subcommand reference | docs/CLI.md |
| Architecture and pipeline | docs/ARCHITECTURE.md |
| Integration topologies (CI / prod / sidecar) | docs/INTEGRATION.md |
| OTel instrumentation per language | docs/INSTRUMENTATION.md |
| CI recipes and PR regression diff | docs/CI.md |
| Full configuration reference | docs/CONFIGURATION.md |
| JSON report schema | docs/SCHEMA.md |
| SARIF output | docs/SARIF.md |
| HTML dashboard | docs/HTML-REPORT.md |
| Interactive TUI | docs/INSPECT.md |
| Daemon HTTP query API | docs/QUERY-API.md |
| Acknowledgments workflow | docs/ACKNOWLEDGMENTS.md |
| GreenOps methodology and limitations | docs/METHODOLOGY.md, docs/LIMITATIONS.md |
| Periodic efficiency disclosures (optional) | docs/REPORTING.md |
| Helm deployment | docs/HELM-DEPLOYMENT.md |
| Operational runbook | docs/RUNBOOK.md |
| Supply-chain provenance (SLSA, Sigstore) | docs/SUPPLY-CHAIN.md |
| Design notes (deep dive) | docs/design/ |
Every GitHub Action is pinned to a 40-character commit SHA; the production image is FROM scratch; Cargo.lock is committed and audited daily by cargo audit; workflow GITHUB_TOKEN permissions default to contents: read. Dependabot opens weekly grouped PRs. Release binaries ship SLSA Build L3 provenance (Sigstore + Rekor) and embedded cargo-auditable dependency data (cargo audit bin), and every release ships an SPDX SBOM attested under the SPDX predicate. Full policy and verification commands: docs/SUPPLY-CHAIN.md.
Releases follow a documented procedure. The companion repo perf-sentinel-simulation-lab is the mandatory pre-tag release gate: 36 end-to-end scenarios on a local Kubernetes (k3d) cluster, covering nine deployment modes plus CI templates, failure modes and load limits, each shipping a Mermaid diagram, the exact inputs/outputs, and the gotchas hit during validation. Step-by-step in docs/RELEASE-PROCEDURE.md.
GNU Affero General Public License v3.0.
Running perf-sentinel does not place your own services under the AGPL. It is a standalone process: your applications only send it OpenTelemetry traces over the network (OTLP), which is arm's-length communication, not linking, so it creates no derivative work and imposes no license obligation on your code. The AGPL covers perf-sentinel's own source. If you modify it and offer the modified version to others over a network, section 13 requires you to make that modified source available to those users. Using the official, unmodified binaries or image carries no such obligation. This is a practical summary, not legal advice, check with your own counsel if in doubt.
Logo and banner by Gwendoline MEIGNEN.