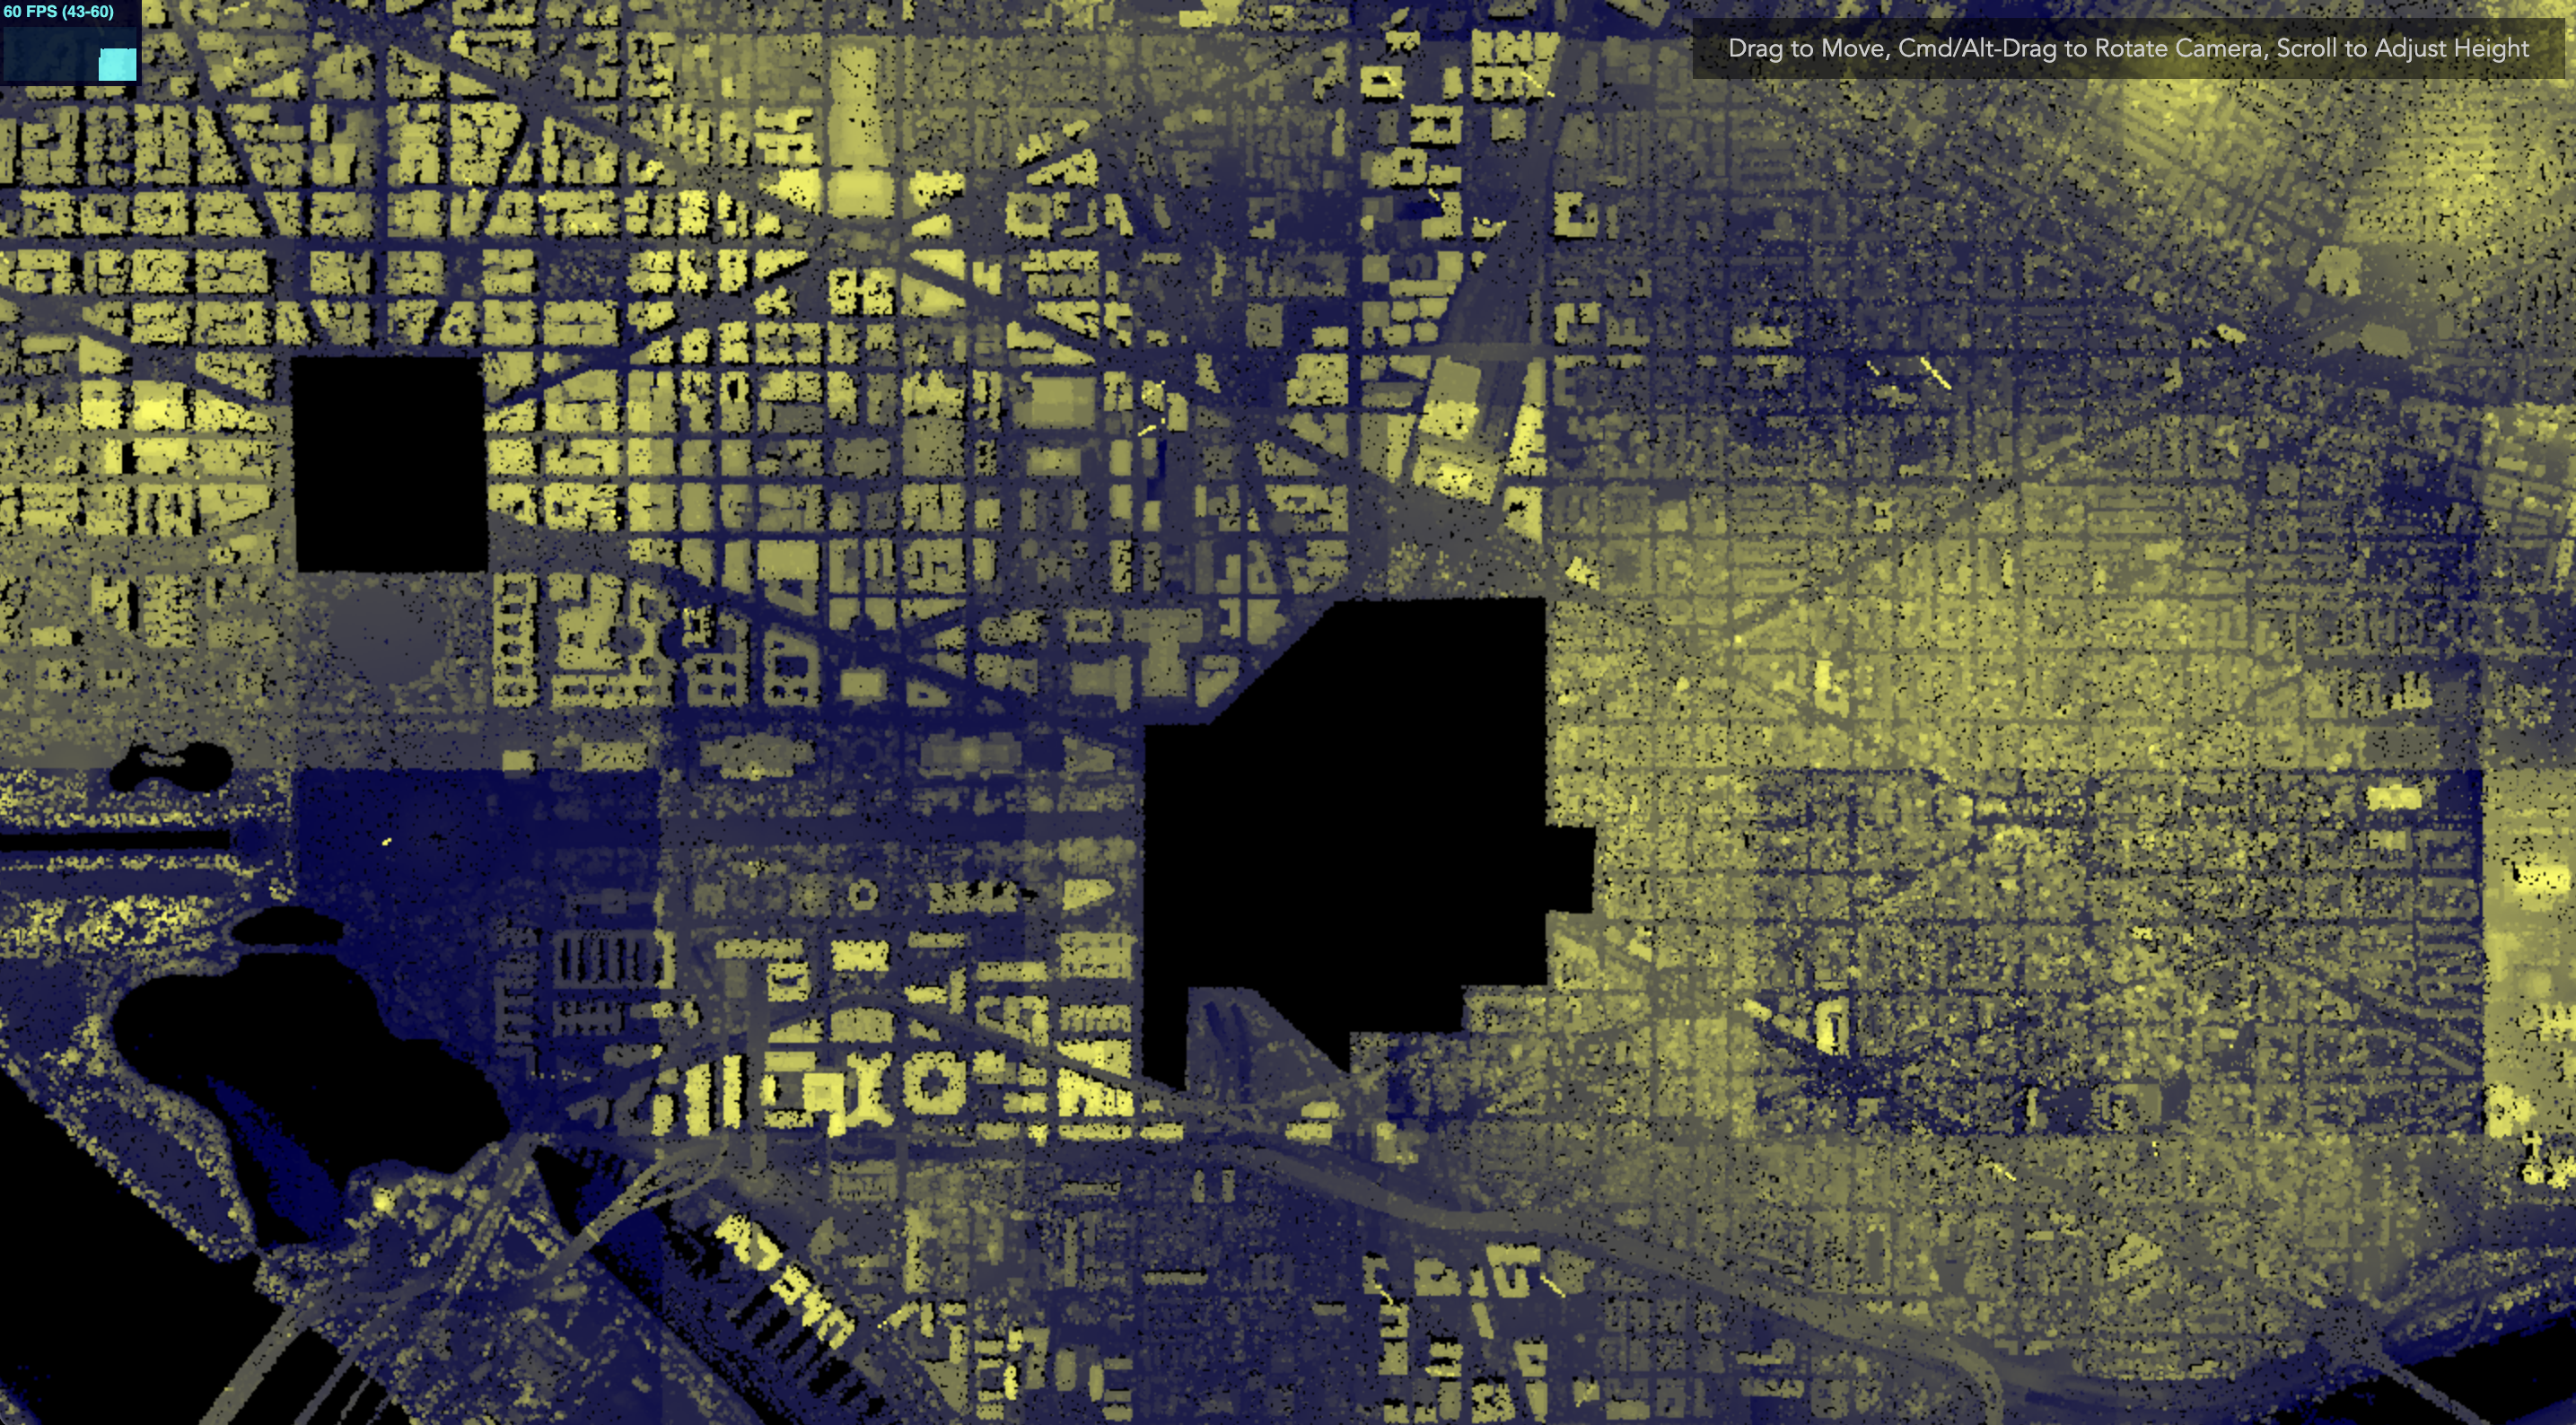
A progressively loading 3D flythrough of the DC LiDAR 2018 dataset
Subdivides the pointcloud map into tiles that have varying resolution levels that can be viewed at different distances. Approximately 850M
points in this pointcloud can be viewed in chunks based on camera movement, similar to the way that a map viewer like Google Maps would
handle progressive loading. The points themselves are rendererd using GL_POINTS with a height-based shader that is anchored at the lowest
point of each tile.
Build instructions are fairly simple:
$ yarn
$ yarn dev
The tiles themselves are constructed offline and uploaded to my CDN.