Local token & cost dashboard for AI coding tools












Try it without installing → tokdash.github.io/demo
Performance: about 30× faster than pre-0.6.0 cold usage scans, and 15× faster than ccusage in the same local benchmark.
Important
Keep your history: Claude Code and Gemini CLI delete local sessions older than ~30 days by default, so Tokdash's earlier months can silently shrink — a one-line config change per client prevents it (History retention).
- Features
- Supported clients
- Quick start
- Configuration
- Privacy & security
- API (local)
- Cost Accuracy Note
- History retention
- Roadmap
- Contributing / security
- Documentation
- Project structure
- License
- Exact token counts: Input/Output/Cache token breakdowns
- Statusline integration [new]: drop a live token-usage indicator into Claude Code's statusline (or any agent that can hit a local HTTP endpoint) — see Statusline integration
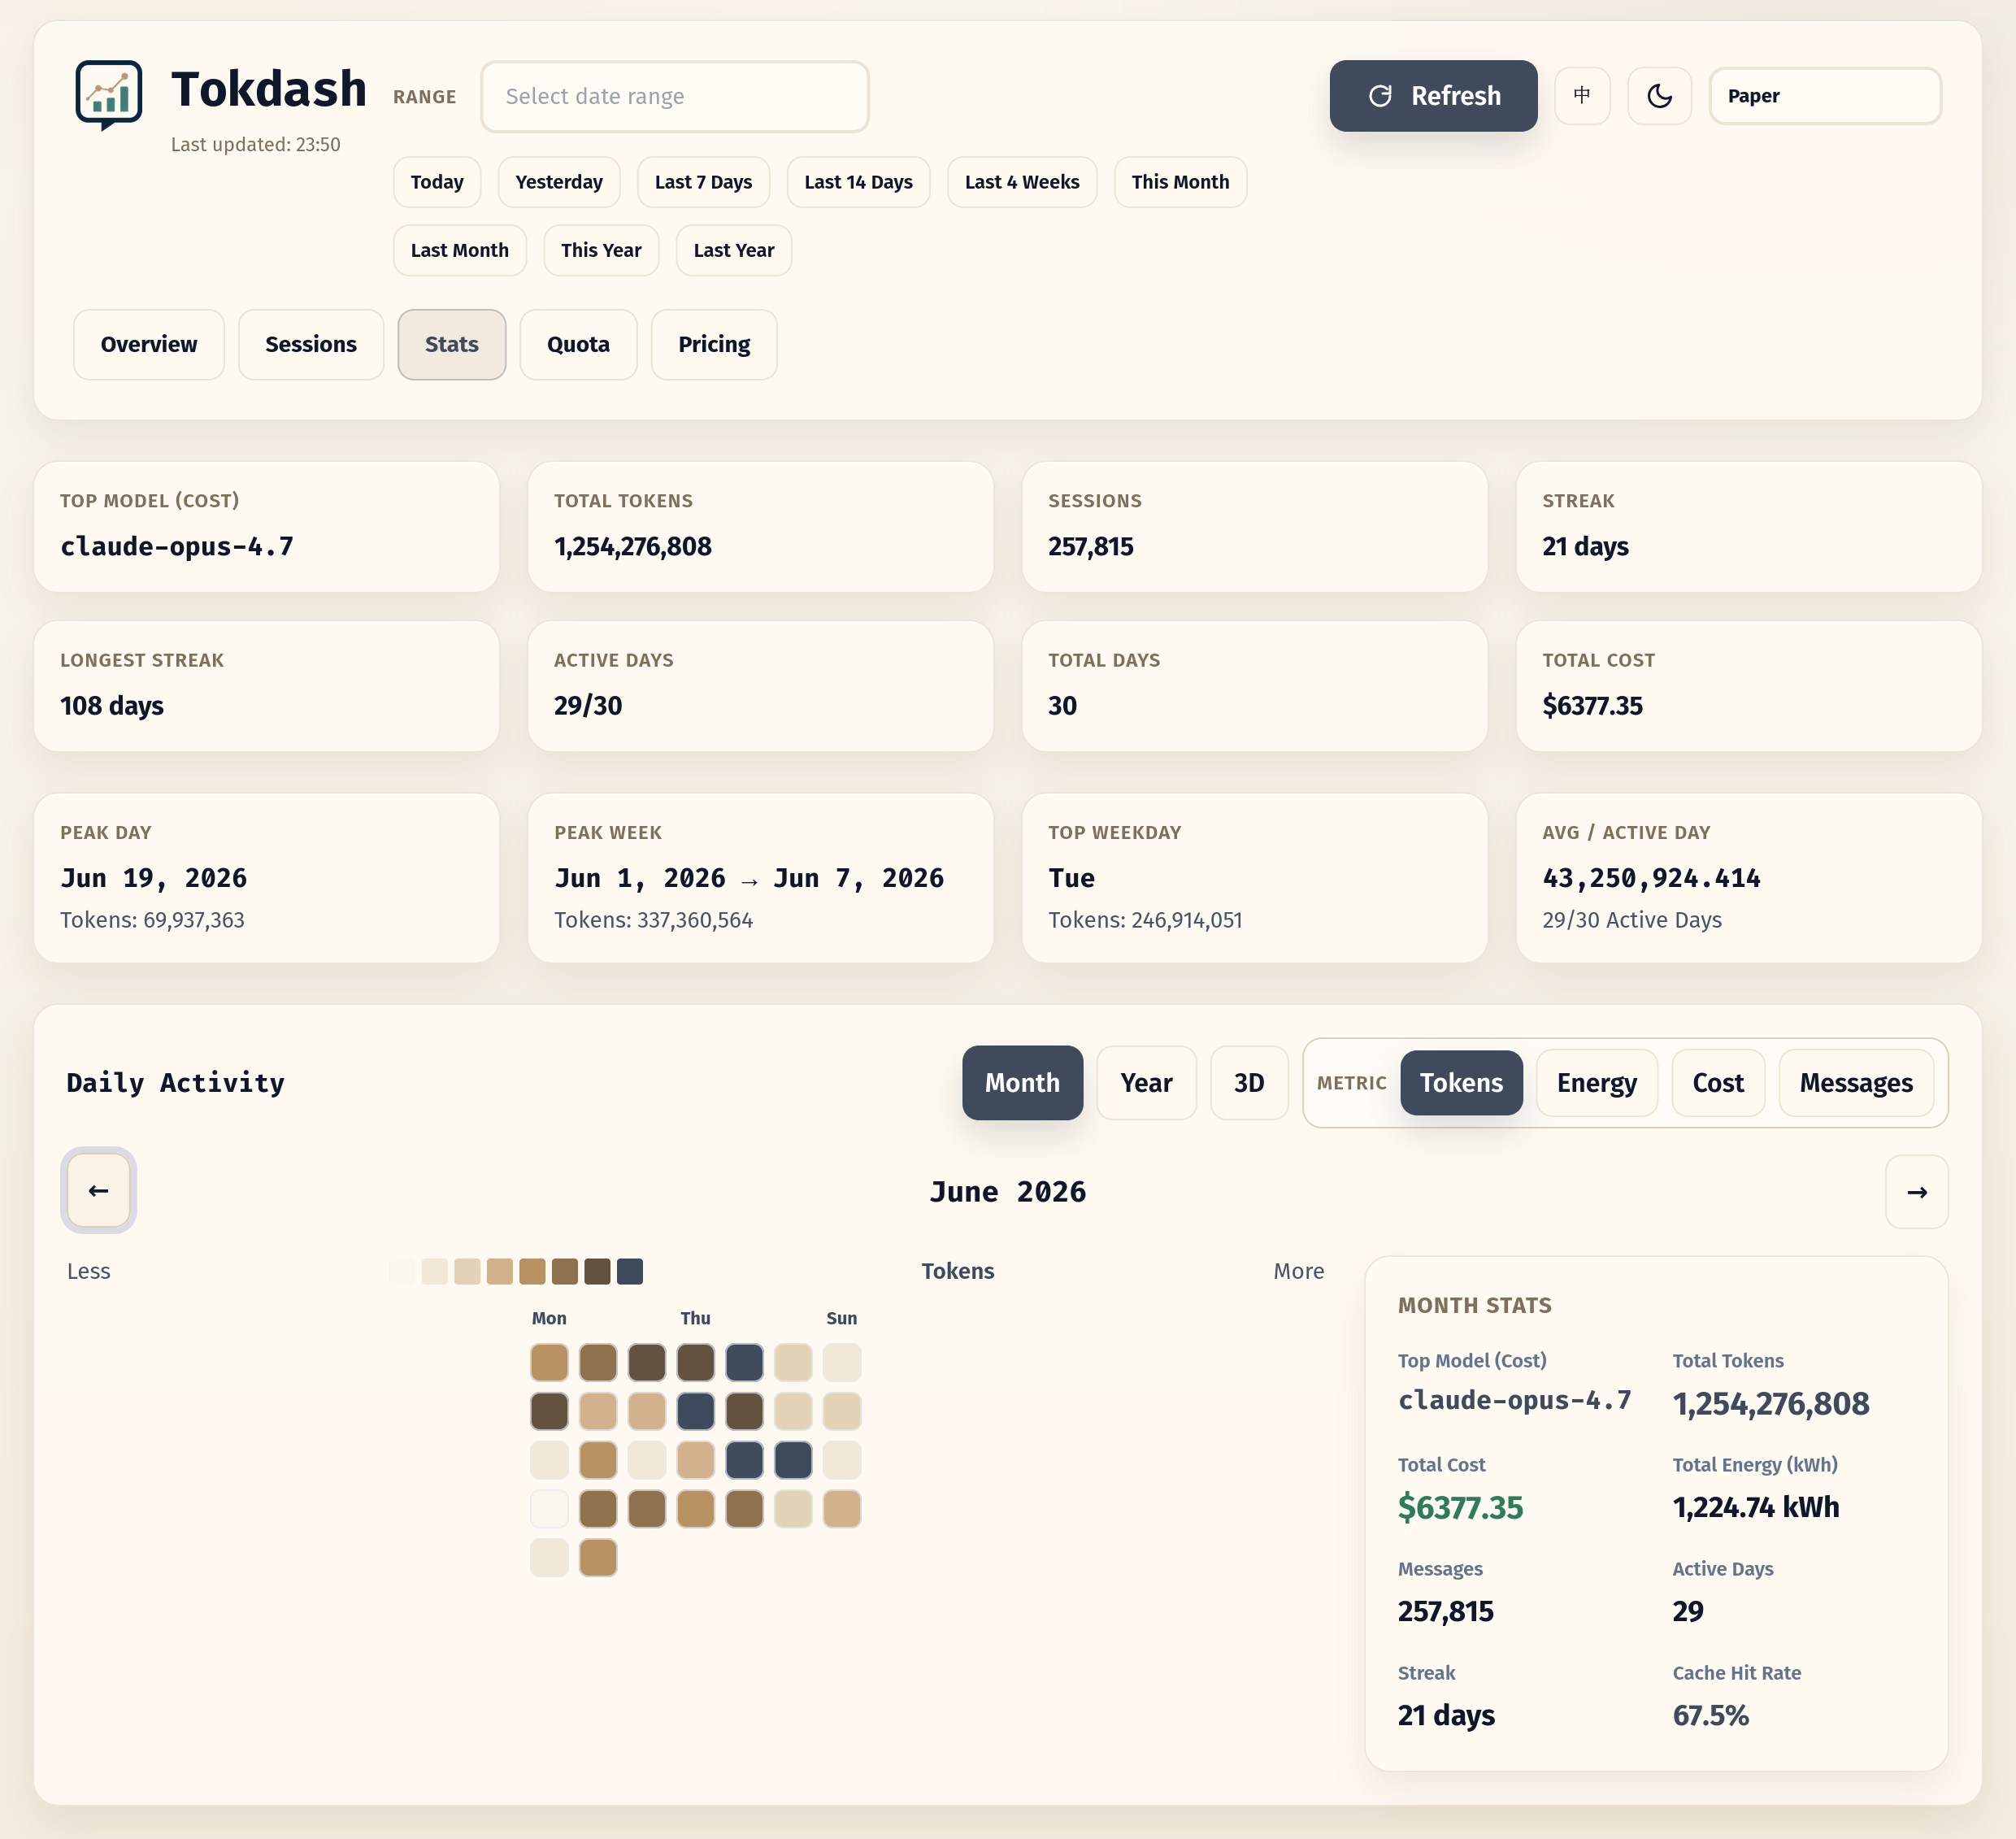
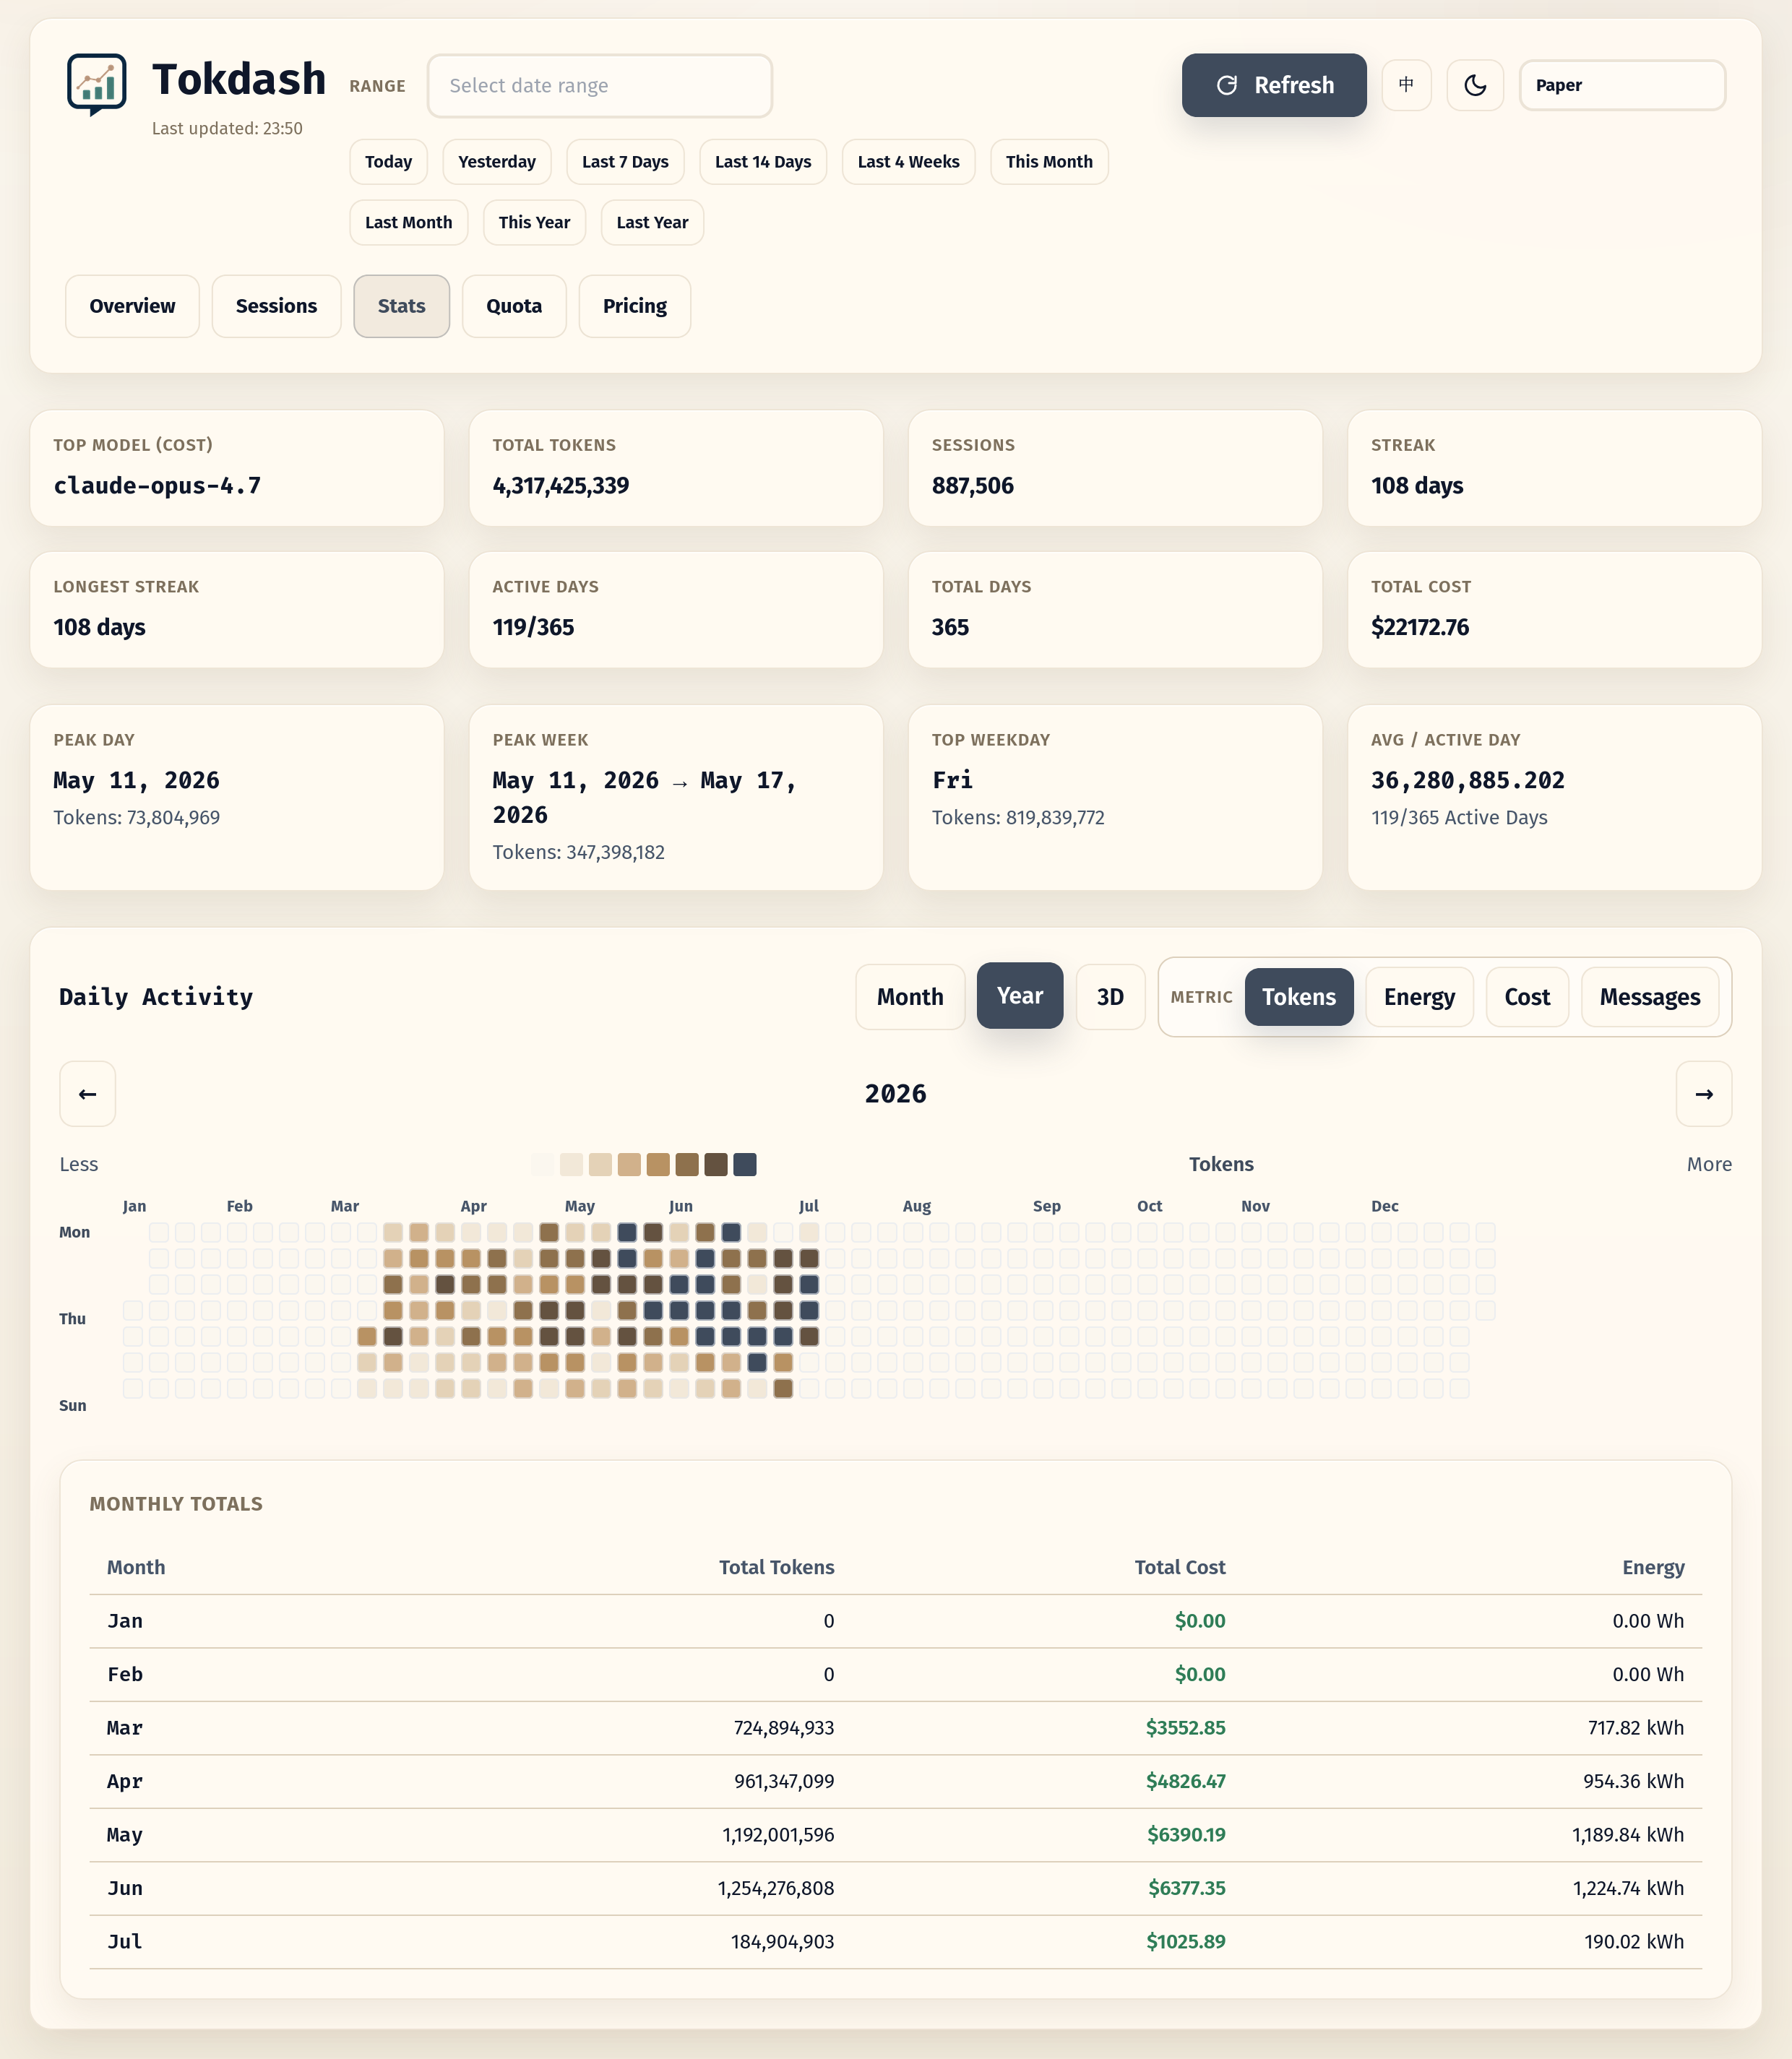
- Contribution calendar: 2D heatmap + 3D isometric view with Tokens/Cost/Messages metrics
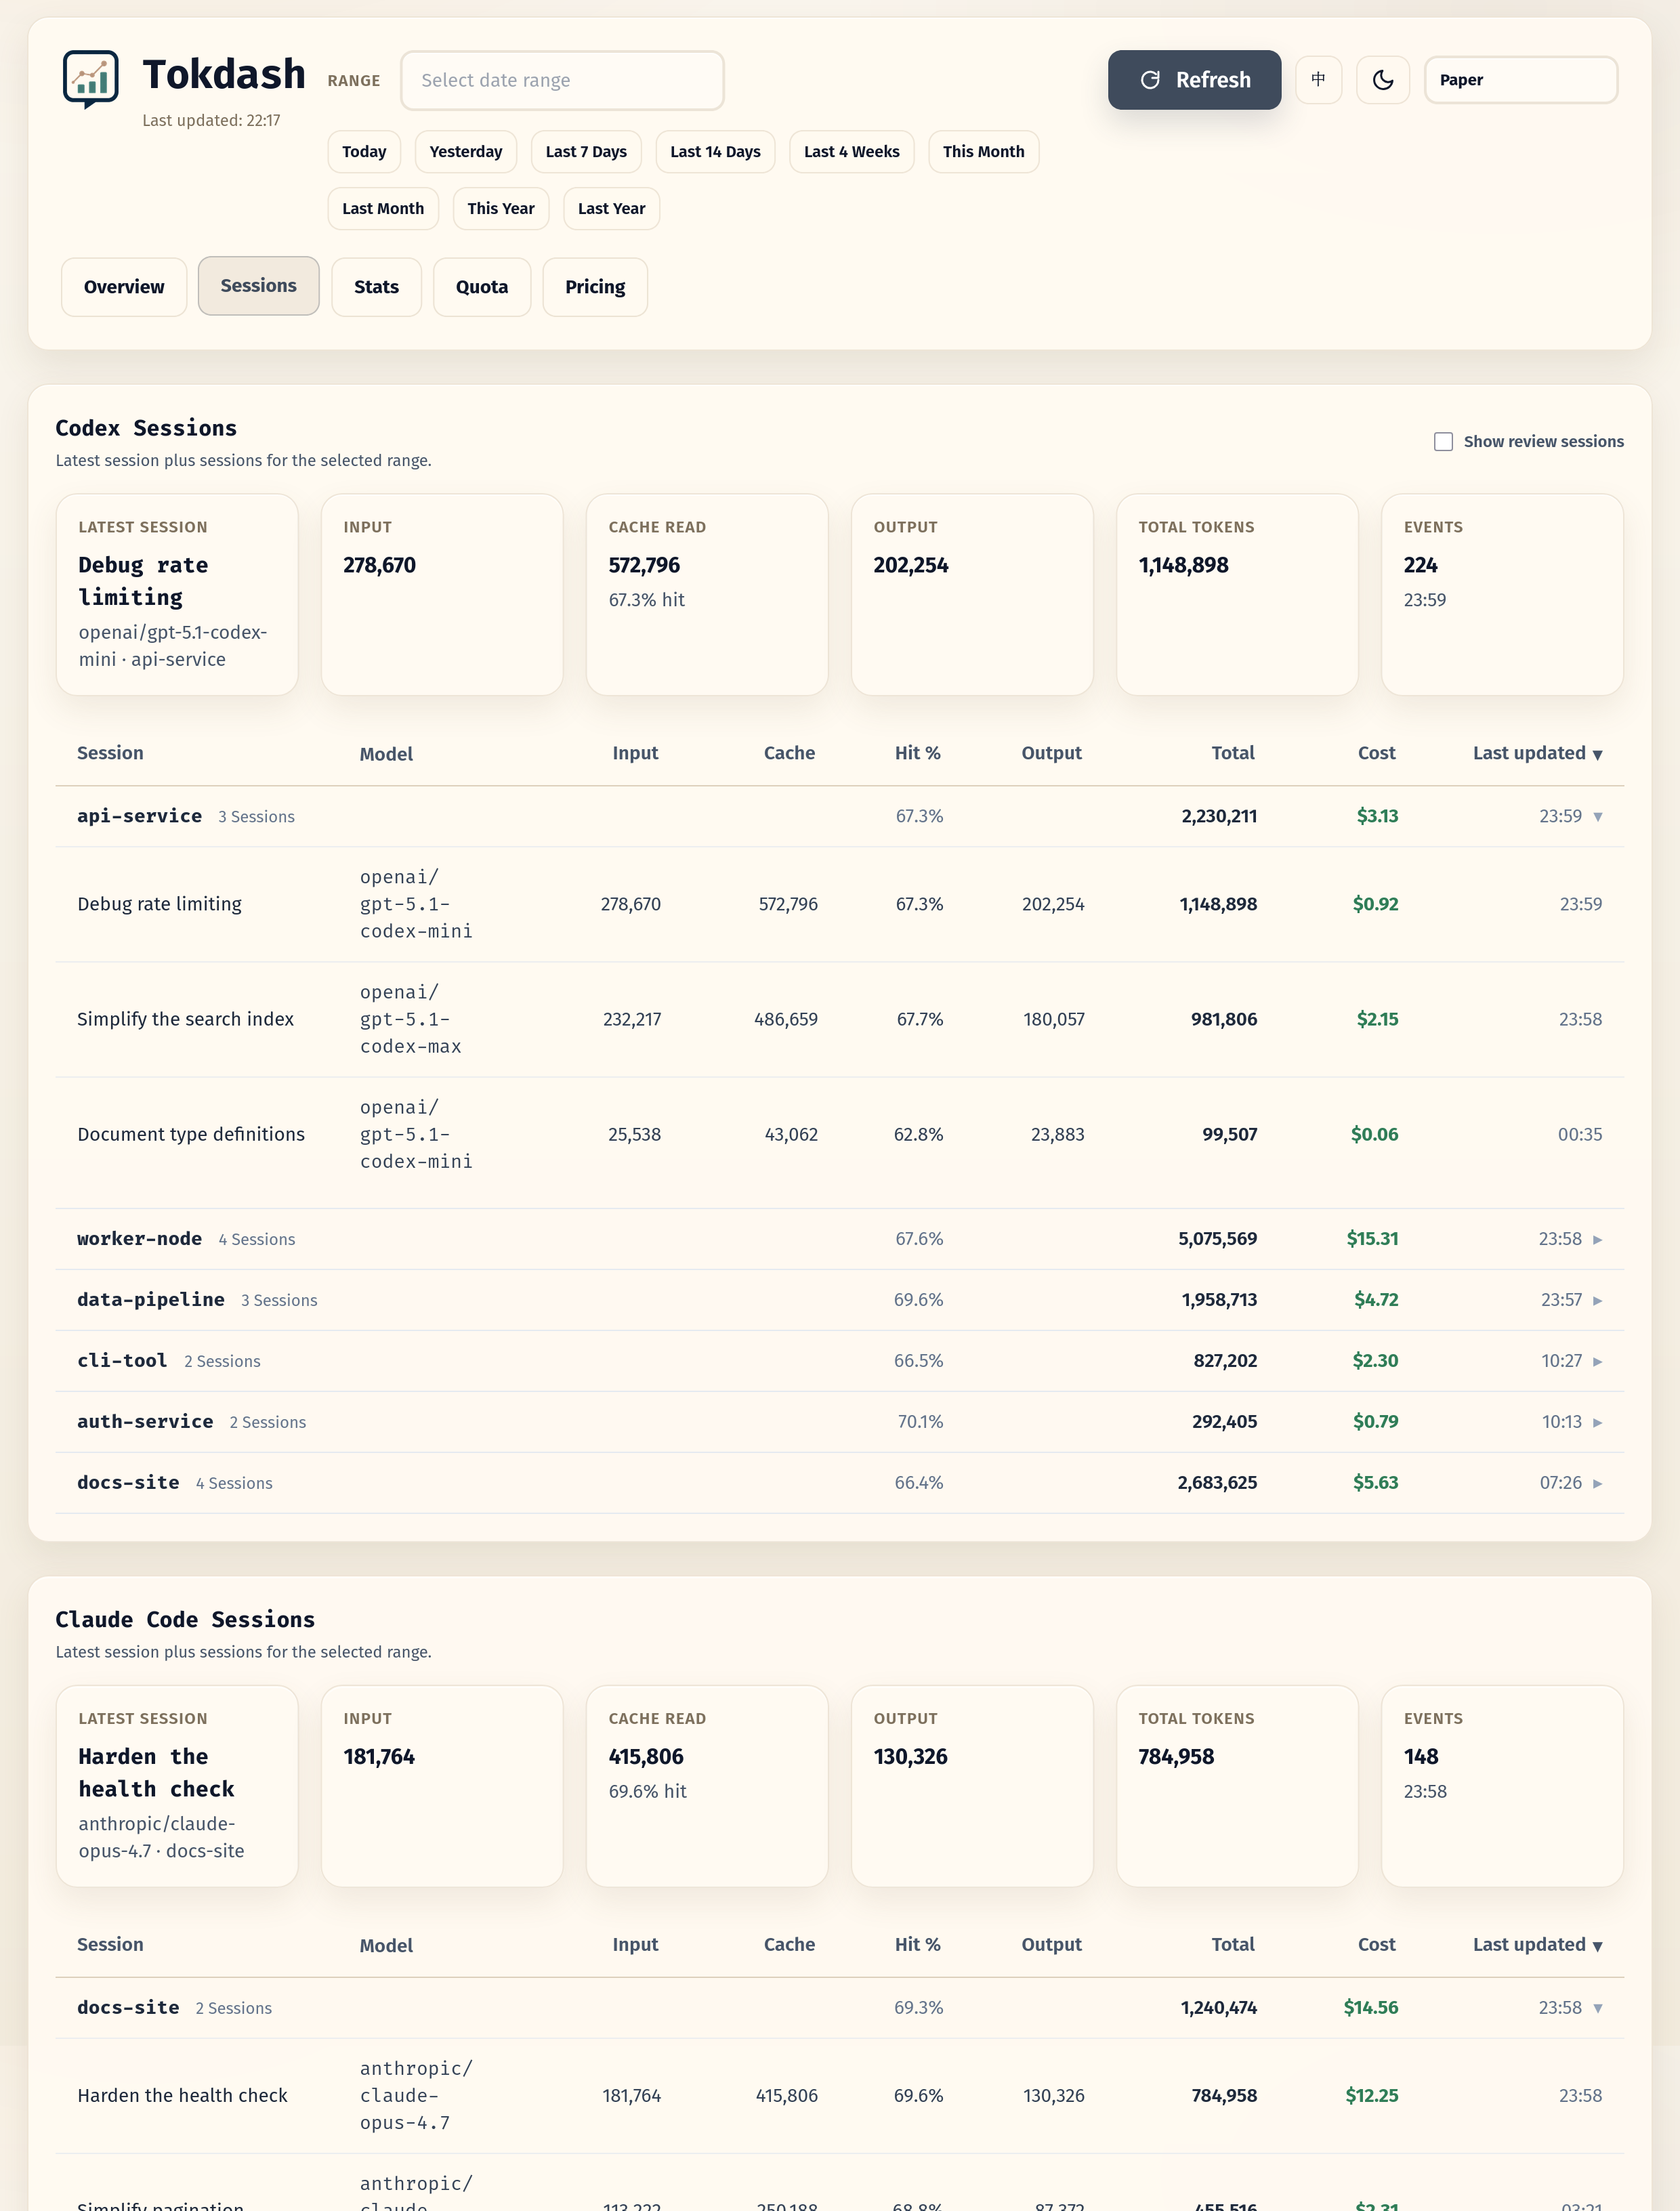
- Session explorer: per-session drill-down
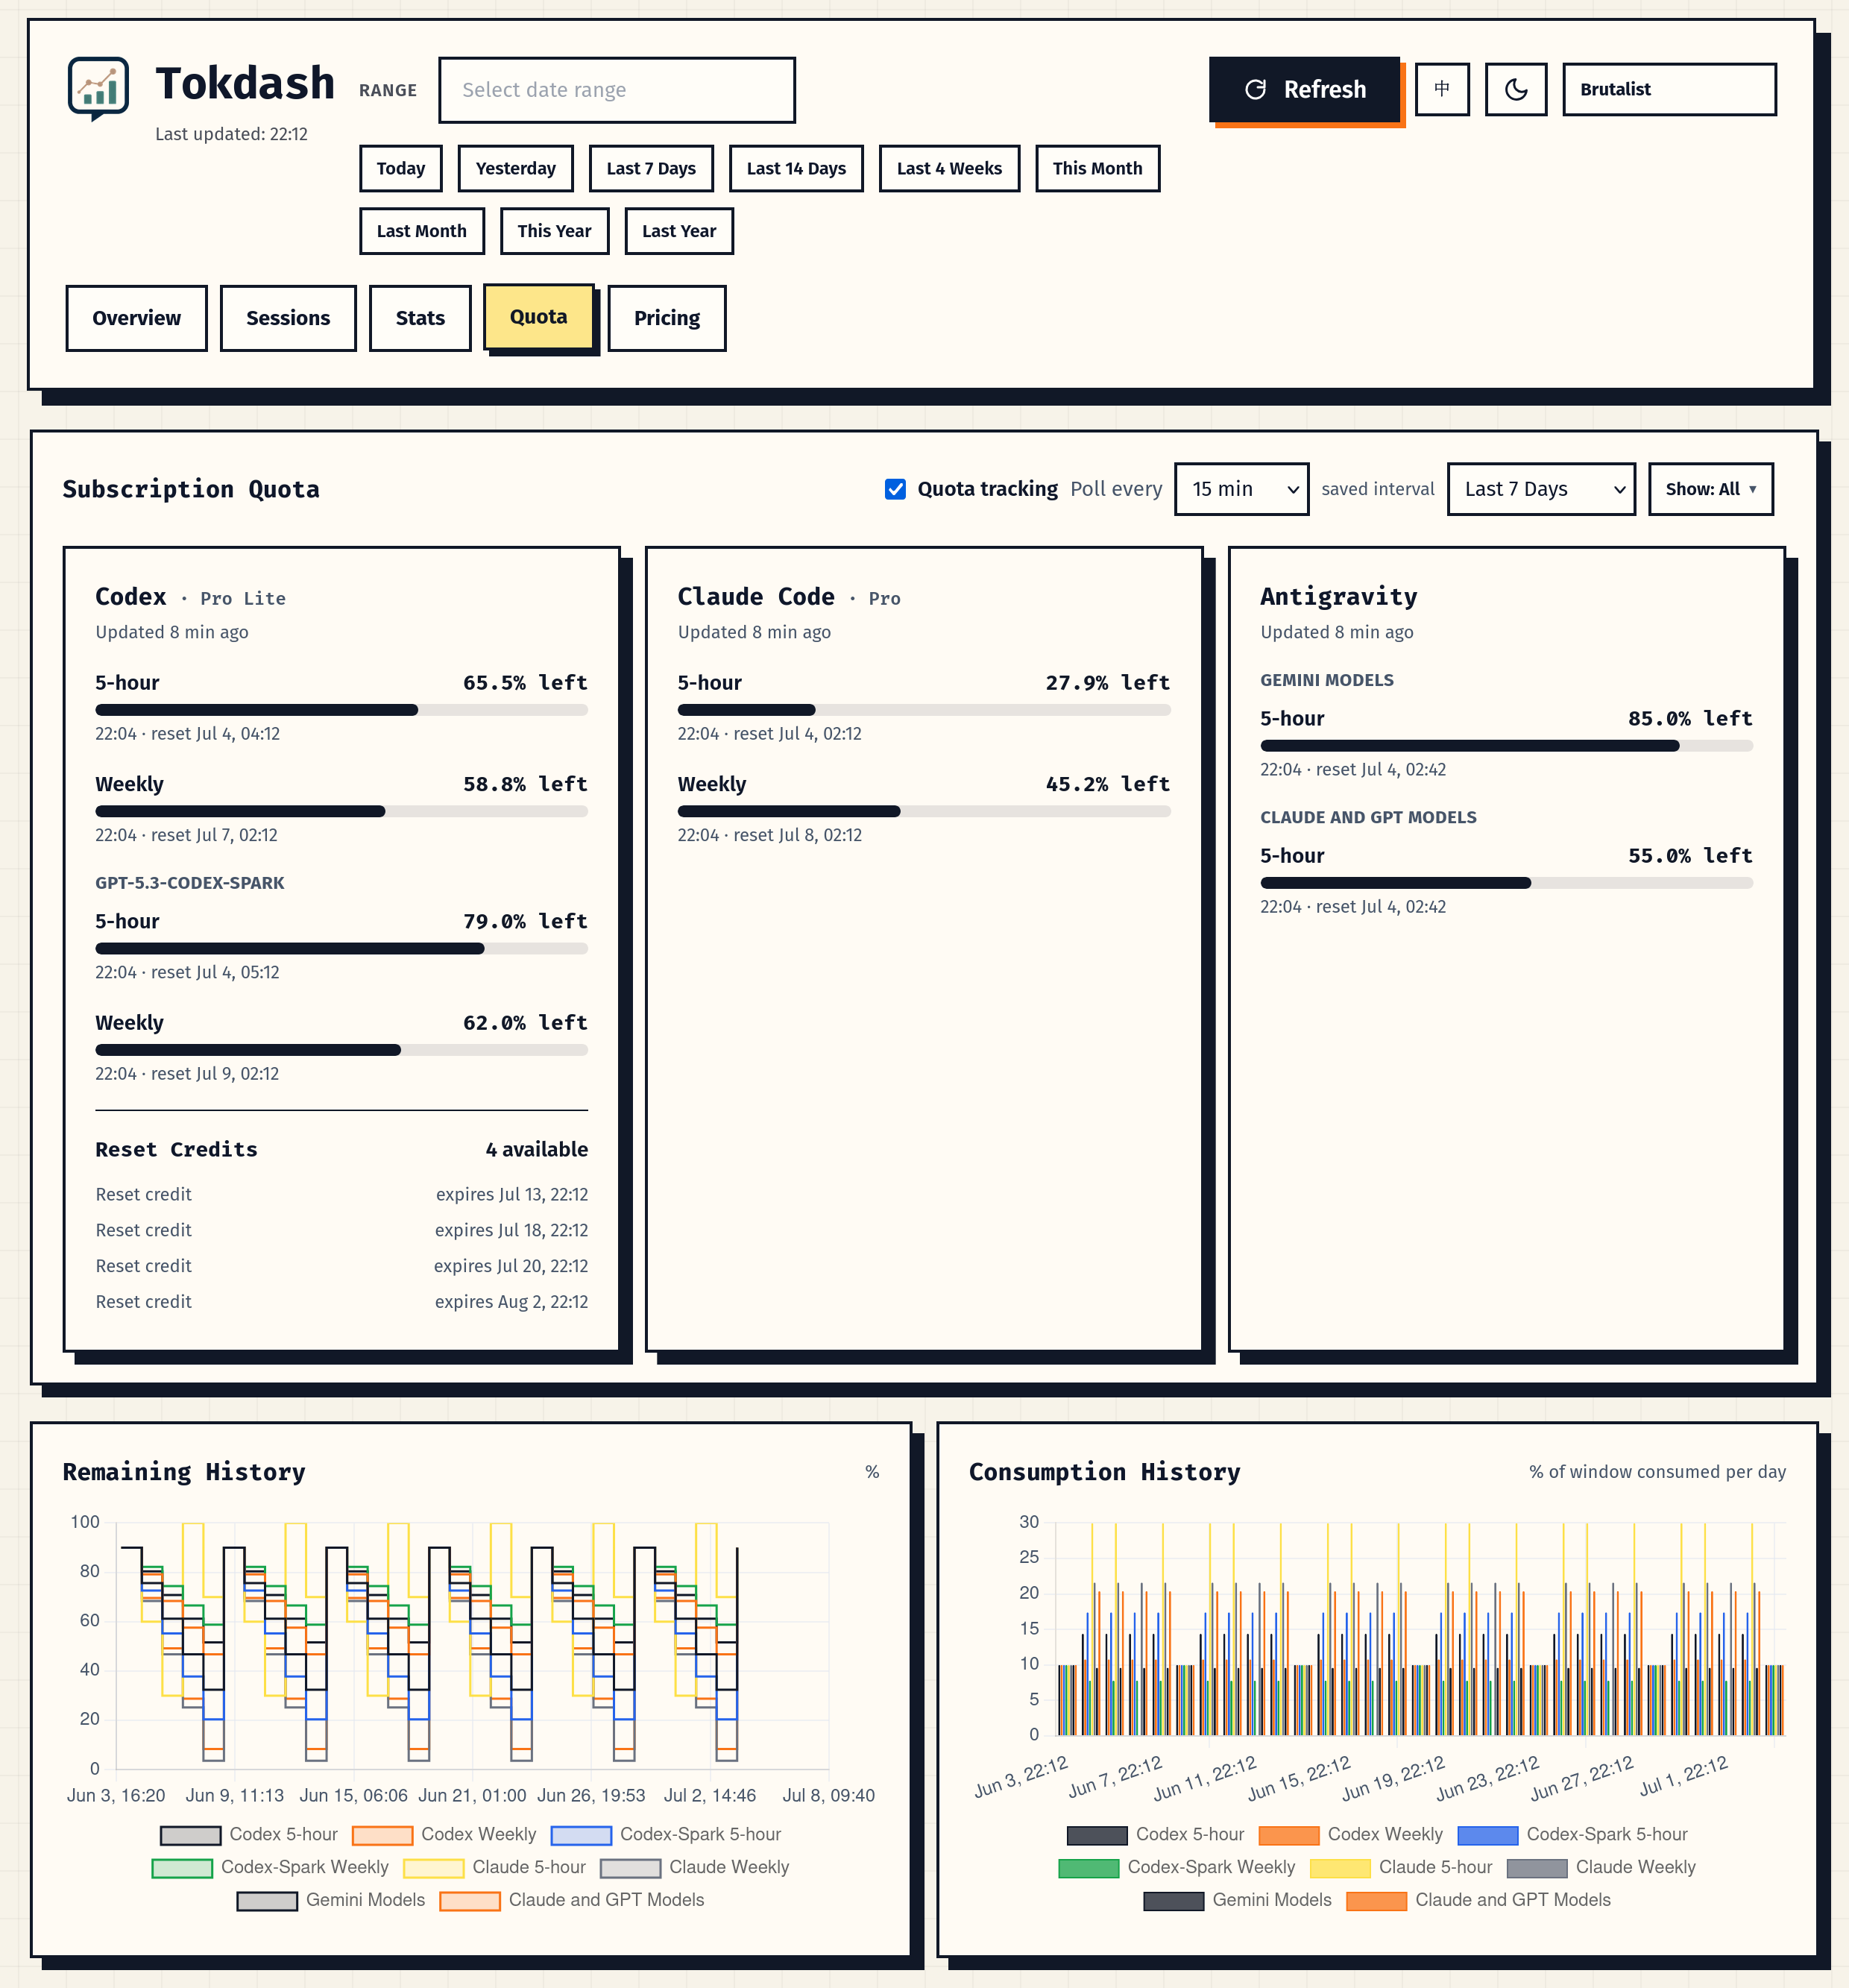
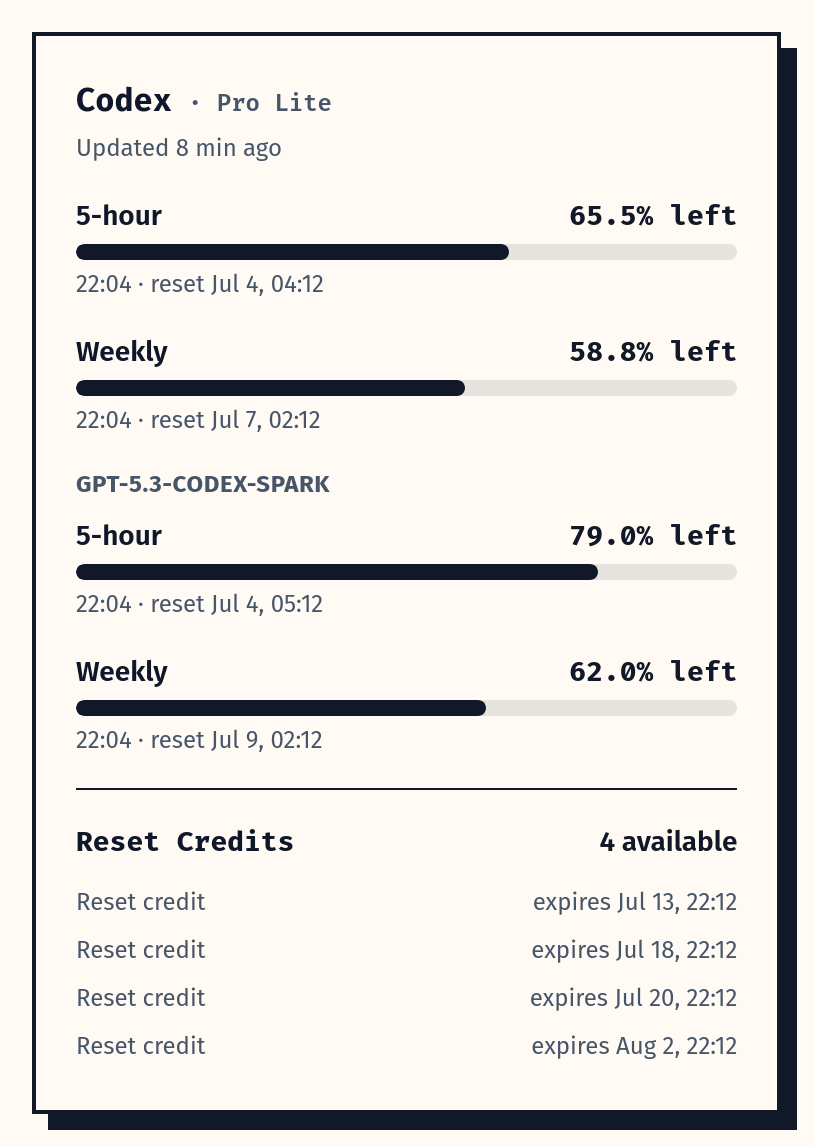
- Quota tab [new]: subscription window bars with reset countdowns for Codex, Claude Code, and Antigravity. Codex windows work out of the box from local logs; Codex reset credits, metered features, and all Claude/Antigravity quota need opt-in live polling
- Themes and app polish: 10 style themes, light/dark mode, and PWA install support
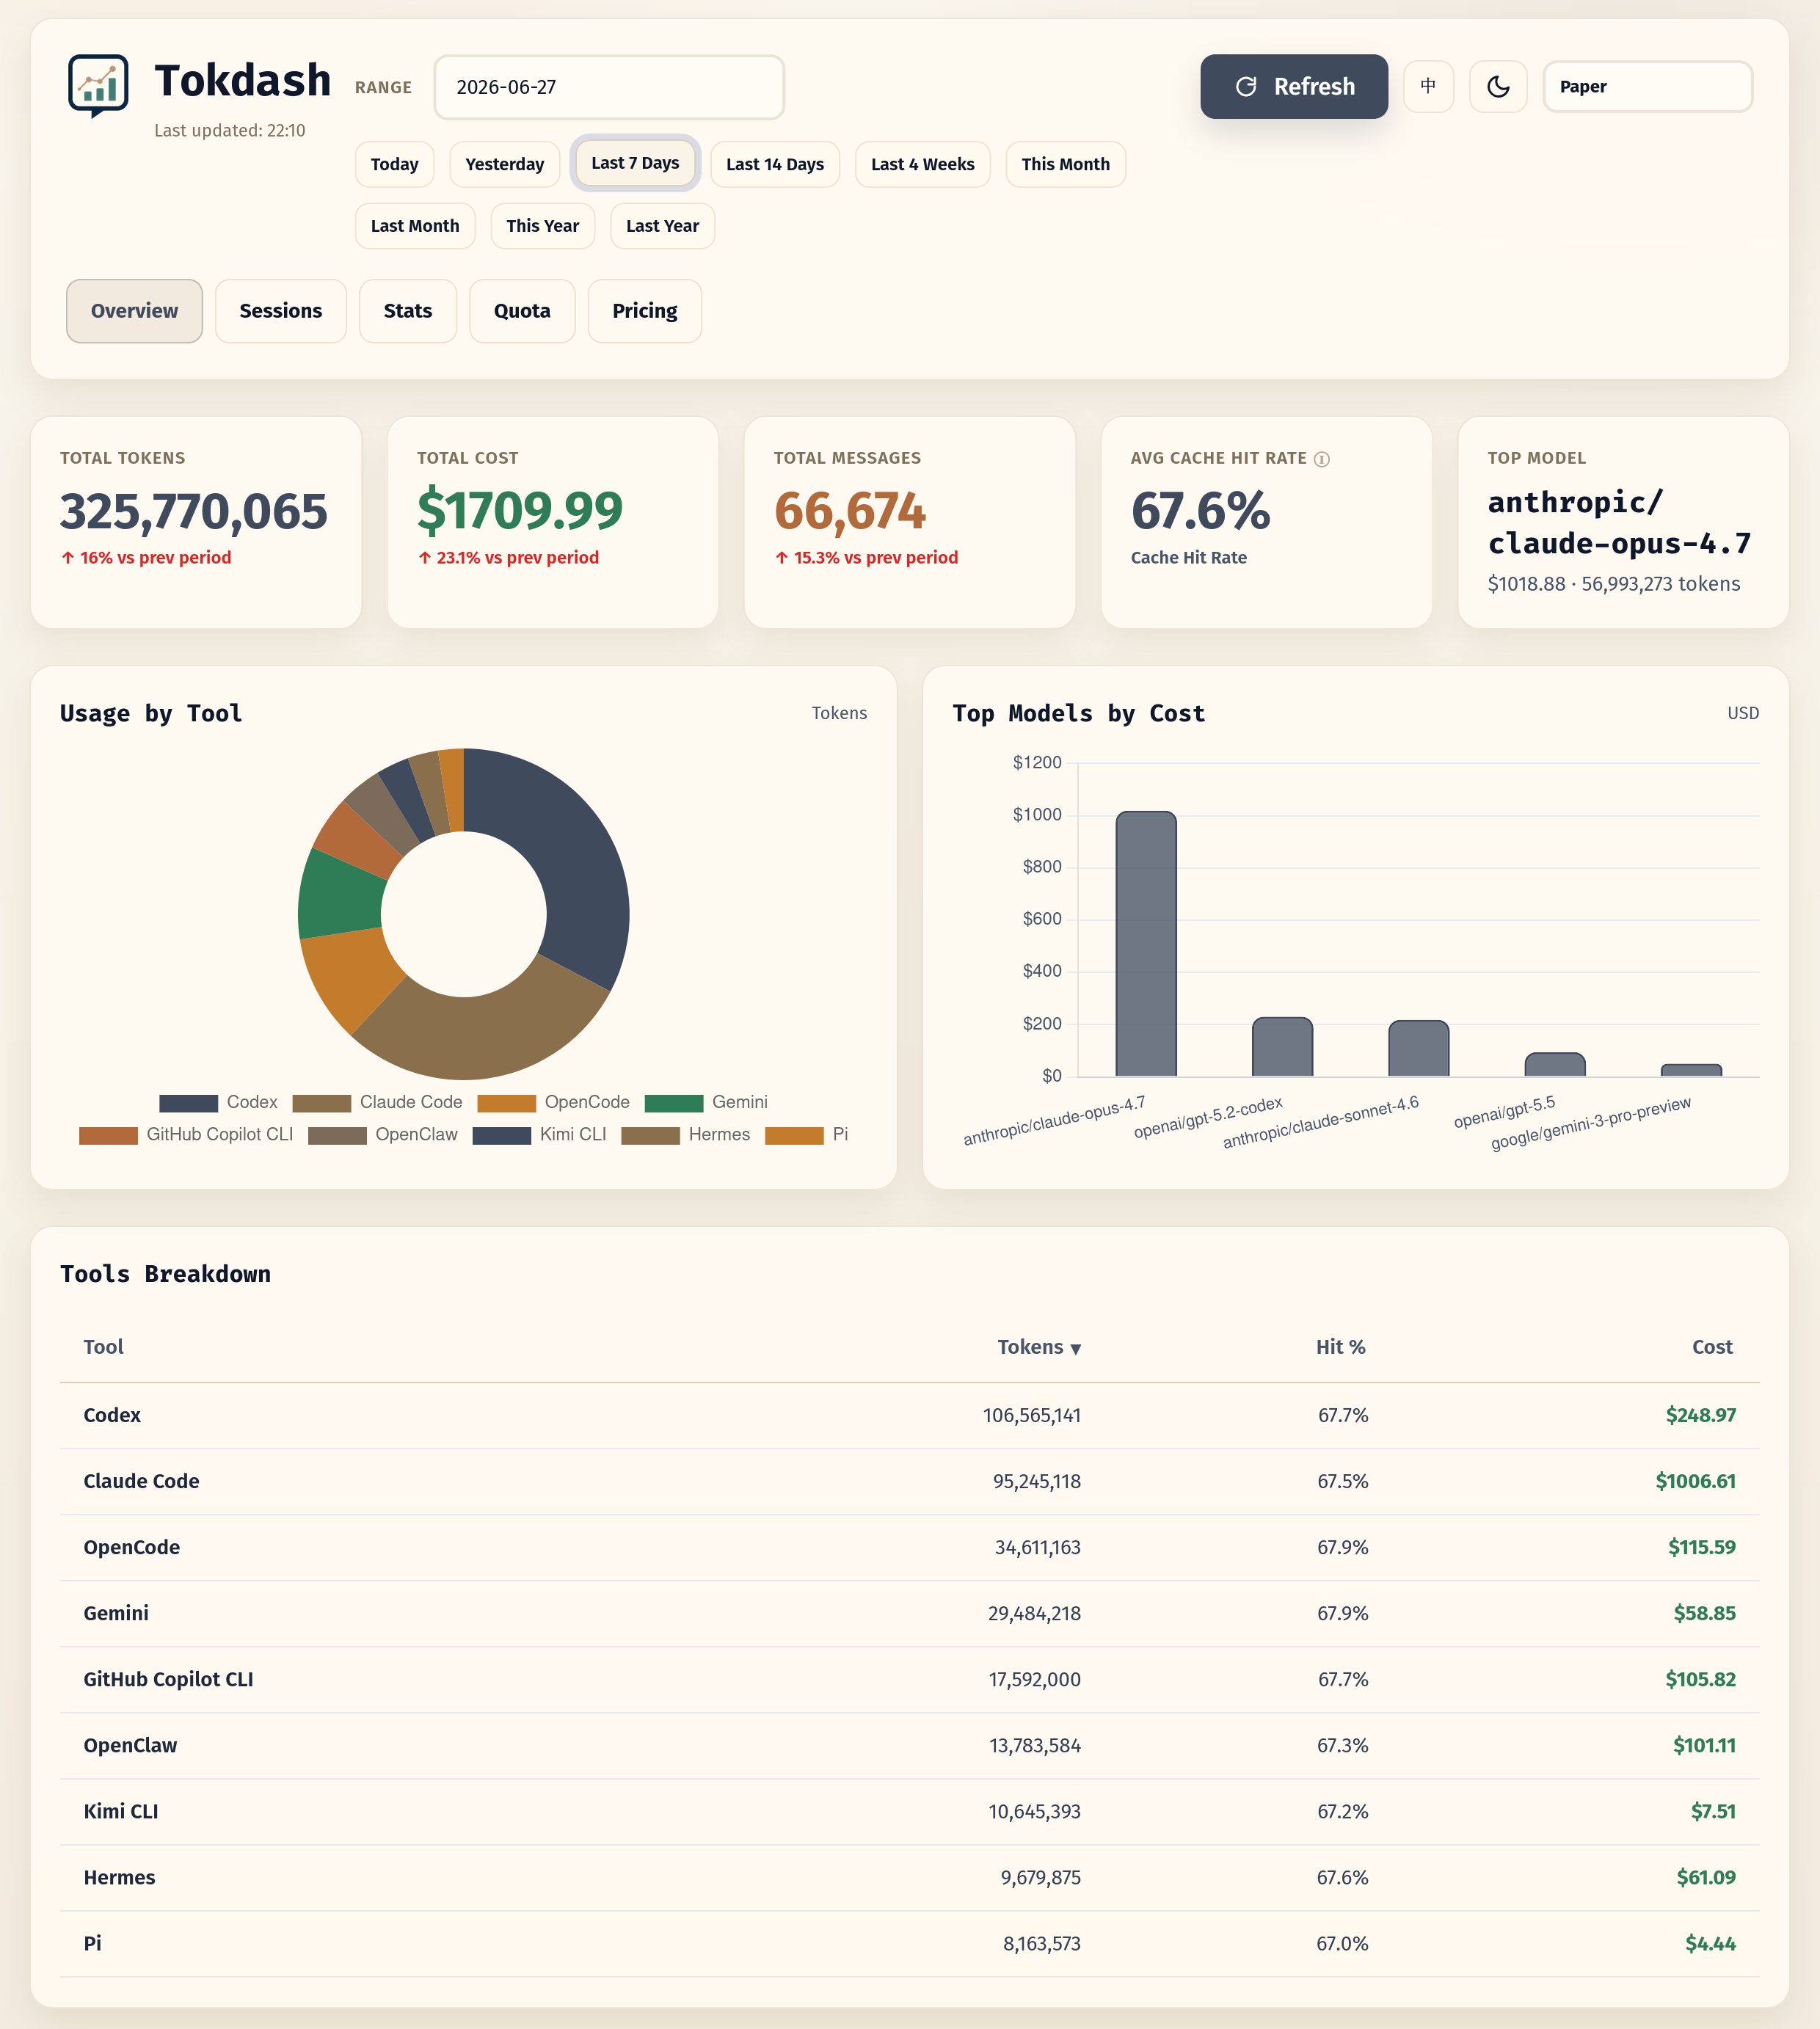
Overview
Sessions
Monthly usage heatmap
Yearly usage heatmap
Quota tracking
Codex quota and reset credits
- Linux (including WSL2): supported
- macOS: supported
- Windows (native): experimental
- Python 3.10+
- One or more supported clients installed
Recommended isolated install:
pipx install tokdashIf you do not use pipx:
python3 -m pip install --user tokdashRun the onboarding wizard:
tokdash setupThe wizard configures a reversible user-level background service when the platform supports
one, then prints the dashboard URL (default: http://127.0.0.1:55423). If no supported
service manager is available, it records setup state and prints foreground run guidance. It
uses localhost-first defaults, does not require sudo for the local service, and keeps your
usage history unless you later uninstall with --purge.
To expose the dashboard explicitly on all network interfaces with writes disabled, run
tokdash setup --bind 0.0.0.0; review the remote-access guide first.
For a non-interactive setup from an agent, script, or bundle:
tokdash setup --auto --jsonTo preview what setup would change:
tokdash setup --dry-runtokdash doctordoctor checks the runtime, background service, configured port, data paths, and update-check
status. Use tokdash doctor --json for automation.
tokdash update       # upgrade the managed runtime and restart the service when possible
tokdash uninstall    # reverse exactly what setup created; keeps usage history by default
update only drives install methods Tokdash can safely manage. If your runtime was installed
by a package manager Tokdash does not own, it prints the exact manual guidance instead of
mutating that environment. For managed runtimes, update reports the Tokdash version before
and after the upgrade; if the version is unchanged, it says Tokdash is already at that version
instead of implying a new package was installed.
Existing installs: migration from before v1.0
If you installed Tokdash before the onboarding flow, upgrade first:
pipx upgrade tokdash
# or: python3 -m pip install --user -U tokdash
Then run tokdash doctor and tokdash setup when you want Tokdash to manage the background
service. If you already have a hand-written systemd or launchd service, setup does not
silently replace it: it refuses unmarked tokdash.service / plist files by default. Keep
managing that service yourself, remove it before setup, or run tokdash setup --force after
checking tokdash setup --dry-run. --force also handles pre-1.0 services that already
occupy port 55423 but do not expose the new /health fingerprint: it rewrites and restarts
the existing tokdash.service. Use tokdash setup --no-service to skip service creation.
If your current setup uses a conda/system/user-pip interpreter and you want tokdash update
to manage future upgrades, migrate the service to Tokdash's setup-owned venv:
# Upgrade the tokdash command you are about to run, for example:
python3 -m pip install --user -U tokdash
# or, for a conda base install:
conda run -n base python -m pip install -U tokdash
tokdash setup --runtime venv --force
tokdash doctor
This keeps your usage history under ~/.tokdash, rewrites the user service to run
~/.tokdash/runtime/python-venv/bin/python -m tokdash, and lets future tokdash update
upgrade that managed venv and restart the service. If you installed with pipx, you can
instead keep the pipx runtime and upgrade with tokdash update or pipx upgrade tokdash.
Tokdash stays loopback-bound by default. Interactive tokdash setup can configure Tailscale
Serve after explicit confirmation, providing private HTTPS read access from Windows or another
tailnet device. Use SSH forwarding when you need authenticated write access. An explicit
--bind 0.0.0.0 provides read-only network access but exposes the unauthenticated dashboard on
every reachable interface.
See docs/guides/REMOTE_ACCESS.md for setup commands, WSL2 guidance,
access URLs, write behavior, and security trade-offs.
If you only want a one-off foreground process:
tokdash serveOpen http://127.0.0.1:55423. Use tokdash serve --port <port> if the default port is busy.
For full onboarding details, including runtime choices, WSL/systemd behavior, macOS launchd,
Tailscale, bundling, update checks, and safe uninstall semantics, see
docs/guides/ONBOARDING.md.
Tokdash can power daily/weekly/monthly OpenClaw usage reports by querying the local API on a schedule.
Copy and paste this prompt to your LLM agent (Claude Code, AmpCode, Cursor, etc.):
Install and configure scheduled Tokdash usage reports for OpenClaw by following the instructions here:
https://raw.githubusercontent.com/JingbiaoMei/Tokdash/main/docs/guides/agents/openclaw_reporting/AGENTS.md

Or read the guide yourself, but seriously, let an agent do it.
Fetch the installation guide and follow it:
curl -s https://raw.githubusercontent.com/JingbiaoMei/Tokdash/main/docs/guides/agents/openclaw_reporting/AGENTS.mdThe local API can power a statusline item in your coding agent (Claude Code, etc.) showing live token/cost stats.
Ready-made templates live in docs/guides/statusline/ — copy one into ~/.claude/scripts/ and add the statusLine block to ~/.claude/settings.json:
statusline-minimal.sh→ one line:[Claude Sonnet 4.6] 📁 myproject | 📊 12.3M ($4.56) todaystatusline-full.sh→ a four-row dashboard with today + week totals and a top-3 per-tool breakdownstatusline.ps1→ the same one-line output as the minimal template, for Claude Code running natively on Windows (PowerShell, nocurl/jqneeded)
All are read-only, localhost-only, and fail silently if Tokdash isn't running. See the folder README for install/config and docs/reference/API.md for the endpoint reference.
Prefer to roll your own? Hand your agent this prompt and point it at docs/reference/API.md:
"I would like to add a statusline item from the tokdash endpoint's API; it should show the total tokens used today."

Tokdash is localhost-only by default.
TOKDASH_HOST(default:127.0.0.1)TOKDASH_PORT(default:55423)TOKDASH_CACHE_TTL(default:600seconds)TOKDASH_COMPUTE_CONCURRENCY(default:2) — cap on simultaneous heavy history reparses; excess cold requests return a fast503instead of saturating the server under loadTOKDASH_LIMIT_CONCURRENCY(default:64) — uvicorn connection cap (backpressure)TOKDASH_KEEPALIVE(default:5seconds) — uvicorn keep-alive timeoutTOKDASH_ALLOW_ORIGINS(comma-separated, default: empty)TOKDASH_ALLOW_ORIGIN_REGEX(default allows only localhost/127.0.0.1)TOKDASH_NO_RETENTION_NOTICE(set to1to silence the history-retention reminder printed ontokdash serve)
Persistent usage DB (default on):
Tokdash maintains a local SQLite index at ~/.tokdash/usage.sqlite3 by default. It stores parsed token rows and Codex/Claude session summaries so repeated dashboard and API reads can use indexed SQL instead of reparsing every source log. Source logs remain the source of truth; the DB is a local performance index, and Tokdash falls back to live parsing if it is disabled or unavailable.
TOKDASH_USAGE_DB(default:1) — set to0,false,no, oroffto disable the persistent usage DBTOKDASH_DATA_DIR(default:~/.tokdash) — base directory for Tokdash local stateTOKDASH_USAGE_DB_PATH(default:$TOKDASH_DATA_DIR/usage.sqlite3) — explicit SQLite file pathTOKDASH_USAGE_DB_DURABLE(default:1) — keep already indexed rows if a source file temporarily disappears or a parser returns no rows; set to0for strict source replacementTOKDASH_USAGE_DB_WATCH(default:0) — set to1to run a background sync loop insidetokdash serveTOKDASH_USAGE_DB_WATCH_INTERVAL(default:30seconds) — sync interval fortokdash db watchand the serve-time watch loop
DB maintenance commands:
tokdash db status --pretty
tokdash db sync --pretty
tokdash db verify --verify-period today --pretty
tokdash db repair --dry-run --pretty
tokdash db resync --pretty
tokdash db watch --pretty
For remote access through Tailscale Serve, SSH forwarding, or an explicit network bind, see
docs/guides/REMOTE_ACCESS.md. Interactive tokdash setup can configure and
record the Tailscale Serve rule after you opt in.
By default tokdash serve opens the dashboard in your browser once on startup. Pass --no-open to disable this (it is also skipped automatically in headless/SSH environments and in the background service templates).
- No telemetry: Tokdash does not intentionally send your data anywhere.
- Local parsing: usage is computed from local session files (see supported clients).
- Optional quota polling: the Quota tab is local-only by default. Per-provider API polling can be enabled from the tab or with
tokdash quota consent; it uses your local CLI credentials only to call that provider's own quota endpoint, and stores responses in the local usage SQLite DB. - Server exposure: Tokdash binds to
127.0.0.1by default. Tailscale Serve provides private read-only access, SSH forwarding provides authenticated write access, and--bind 0.0.0.0explicitly exposes unauthenticated reads on every interface. See the remote-access guide.
The Quota tab shows subscription utilization windows and reset timers, from two data sources. Local logs (no network): Codex records its own quota in session files, so the Codex 5-hour/weekly windows work out of the box — but they update only when you use Codex, and the logs never contain reset credits or metered-feature windows. Treat session-log Codex consumption as an estimate that can be materially wrong: each session caches its quota snapshot at its last fetch and replays it unchanged on every later message, so the numbers can be stale, and reset-boundary noise can occasionally distort a window further — the Quota tab labels these charts as estimated. Live polling (off by default, per-provider consent): Tokdash calls the provider's own quota endpoint with the sign-in your CLI already has — fresher, adds Codex reset credits and metered features, is required for accurate Codex consumption, and is the only source for Claude Code and Antigravity quota:
tokdash quota consent --codex-api on --claude-api on --antigravity-api on
tokdash quota consent --poll-interval 30      # background poll cadence: 15, 30, 60 or 120 min
tokdash quota consent --enabled off           # master switch: turn ALL quota tracking off
tokdash quota poll
tokdash quota show
Master switch. quota.enabled (default on) turns all quota work on or off — session scanning, network polling, and snapshot writes. Toggle it from the Quota tab or with tokdash quota consent --enabled on|off. When it is off (or the TOKDASH_QUOTA_POLL=0 kill switch is set), the background poller idles completely, GET /api/quota/refresh returns a "quota tracking disabled" error, and the tab shows an enable quota tracking card instead of data. Per-provider consent keys keep their narrower network-only meaning.
Poll interval. The background poller snapshots every 30 minutes by default. Choose 15/30/60/120 minutes from the Quota tab, during tokdash setup, or with tokdash quota consent --poll-interval N; it is saved as quota.poll_interval_minutes in config.json. The TOKDASH_QUOTA_POLL_INTERVAL env var (seconds, floor 300) overrides the saved value, and the tab shows which source is active. Interval changes apply on the next poll cycle without restarting the server. Codex session ingestion is incremental — after a one-time backfill of your history, each cycle only tail-reads session files that grew, so a steady-state poll costs single-digit milliseconds.
When enabled, Tokdash reads credentials from $CODEX_HOME/auth.json, Claude's CLAUDE_CODE_OAUTH_TOKEN override or $CLAUDE_CONFIG_DIR/.credentials.json, and ~/.gemini/antigravity-cli/antigravity-oauth-token, then calls only the corresponding provider quota endpoints. On macOS, Claude Code stores its credentials in the Keychain rather than .credentials.json; if neither the env var nor .credentials.json exists, Tokdash reads the Keychain item (Claude Code-credentials) directly — read-only, and the first read may show a one-time Keychain permission prompt. If the Keychain is unavailable (locked, denied, headless session), set CLAUDE_CODE_OAUTH_TOKEN (create one with claude setup-token) as an override. Tokdash never refreshes or writes provider credentials. TOKDASH_QUOTA_POLL=0 is a hard kill switch for all quota tracking. tokdash export excludes quota data by default; use --include-quota only when you intentionally want it in the JSON.
tokdash setup offers an optional quota step (per-provider network consent, default No, plus the poll interval), and tokdash doctor reports the quota state: master switch, per-provider consent, kill switch, effective interval and its source, last poll time, and the stored snapshot count.
Quota snapshots and their history live in the local usage database (usage.sqlite3, enabled by default) and are kept indefinitely by default — set TOKDASH_QUOTA_RETENTION_DAYS to a positive number of days to prune older snapshots. If you opt out of local persistence with TOKDASH_USAGE_DB=0, the Quota tab loses its main data path: no snapshot history is kept, the background poller does not run, and the tab only shows in-memory results from a manual Refresh (network providers with consent) for the lifetime of the current server process. Keep the usage DB enabled (the default) for normal quota tracking.
Tokdash is a local HTTP server. Common endpoints:
GET /api/usage?period=today|week|month|NGET /api/usage?date_from=YYYY-MM-DD&date_to=YYYY-MM-DDGET /api/tools?period=...(coding tools only)GET /api/openclaw?period=...(OpenClaw only)GET /api/sessions?tool=codex|claude|opencode|pi_agent|mimo&period=...(append&include_review_sessions=trueto include Codex review/permission sessions, hidden by default)GET /api/quotaandGET /api/quota/history(subscription quota snapshots; network refresh is write-gated and opt-in)GET /api/stats(contribution calendar & statistics)
Example:
curl 'http://127.0.0.1:55423/api/usage?period=today'Full API reference: docs/reference/API.md — schema, parameters, and response shapes for every endpoint.
Token counts depend on what each client logs locally. Costs are computed from the bundled pricing database (src/tokdash/pricing_db.json) by default, or from your saved dashboard pricing override at <data_dir>/pricing_db.json when present (the Pricing tab writes there and it fully replaces the bundled rates). Either way they may lag real provider pricing — use as an estimate and verify against your billing source if it matters.
Tokdash reads each client's local session logs and also keeps a local SQLite performance index. The index can keep rows Tokdash has already seen, but it cannot recover logs that were deleted before they were indexed, and it is not a replacement for keeping the original client history. If a client deletes old logs before Tokdash syncs them, a past month can still read lower than when you first recorded it. Only two supported clients do this by default, and both are a one-line fix:
- Claude Code deletes sessions older than
cleanupPeriodDays(default 30 days) at startup. Add this to your existing~/.claude/settings.json(and any alternateCLAUDE_CONFIG_DIR):{ "cleanupPeriodDays": 3650 } - Gemini CLI deletes sessions older than 30 days. Disable it in
~/.gemini/settings.json; if a project has.gemini/settings.json, make the same change there because workspace settings override user settings:{ "general": { "sessionRetention": { "enabled": false } } }
Every other supported client keeps history indefinitely by default. For the full per-client survey, fix details, and what the local SQLite index does and does not preserve, see docs/reference/HISTORY_RETENTION.md.
See docs/development/ROADMAP.md.
- Contributing guide:
docs/CONTRIBUTING.md - Security policy:
docs/SECURITY.md
Full documentation lives in docs/ (start at the index), grouped into:
- guides/ — task-oriented setup: onboarding, remote access, statusline, background service.
- reference/ — lookup material: API reference, supported clients, history retention.
- development/ — changelog, releasing, roadmap, and
internals/design notes.
tokdash/
├── main.py                 # Source entrypoint (python3 main.py)
├── tokdash                 # Source CLI wrapper (./tokdash serve)
├── src/
│   └── tokdash/
│       ├── cli.py
│       ├── api.py                # FastAPI routes/app
│       ├── compute.py            # Aggregation/merging logic
│       ├── dateutil.py           # Shared date-range parsing
│       ├── sessions.py           # Session explorer logic
│       ├── pricing.py            # PricingDatabase wrapper
│       ├── assets.py             # Static asset management
│       ├── model_normalization.py
│       ├── pricing_db.json
│       ├── sources/
│       │   ├── openclaw.py       # OpenClaw session log parser
│       │   └── coding_tools.py   # Local coding tools parsers
│       └── static/
│           ├── index.html        # Single-page dashboard
│           ├── theme-config.js   # Theme palettes & heatmap colors
│           └── themes.css        # Per-theme CSS overrides
└── docs/                   # Documentation — see docs/README.md for the index
    ├── guides/             # Onboarding, remote access, statusline, background service
    ├── reference/          # API reference, supported clients, history retention
    └── development/        # Changelog, releasing, roadmap, internals/ design notes
MIT License - see LICENSE.